Black-Scholes calculator for ESOP valuation
A free ESOP valuation calculator: find the fair value of employee stock options and SARs under IFRS 2, Ind AS 102 or US GAAP, in your currency, for one grant or tranche by tranche.
By Anjali Aggarwal
Black-Scholes ESOP calculator
ESOP fair value for options and SARs. The result updates as you type.
Six things to remember
- Black-Scholes is the standard model for ESOP valuation. It gives the fair value of an option, not the value of a share, and IFRS 2, Ind AS 102 and US GAAP (ASC 718) all accept it. It is not the share value that tax rules use at exercise.
- Equity-settled awards are valued with the share price and assumptions on the grant date, and are never revalued. Cash-settled awards, such as cash SARs and phantom stock, are revalued at every reporting date until they are paid.
- Six inputs drive the value. Volatility and expected term are the judgement calls that move it most; the risk-free rate moves it least.
- Each vesting tranche has its own expected term and its own value, and the expected term can never be shorter than the vesting period.
- The risk-free rate must match the currency of the exercise price: the zero-coupon government bond yield for that currency and term.
- Options granted far below the share price behave almost like shares. Options priced at the market get most of their value from time value, and are far more sensitive to the assumptions.
What Black-Scholes means for ESOP valuation
An employee stock option is a right, not an obligation, to buy a share at a fixed exercise price once it vests. That right is worth something even when the share price is at or below the exercise price today, because the price may rise before the option is exercised, while the holder's loss is capped at zero. The Black-Scholes model, published by Fischer Black and Myron Scholes in 1973 and extended by Robert Merton to allow for dividends, turns that right into a single number: the fair value of the option. For a company, that number is the heart of ESOP valuation, because it decides how much the grant costs in the accounts.
Three numbers that are easy to confuse
| Number | What it measures | Where it is used |
|---|---|---|
| Market value of a share | What one share is worth on a date. In India, the fair market value for tax on unlisted shares comes from a SEBI-registered Category I Merchant Banker | The share price input, and employee tax at exercise or vesting |
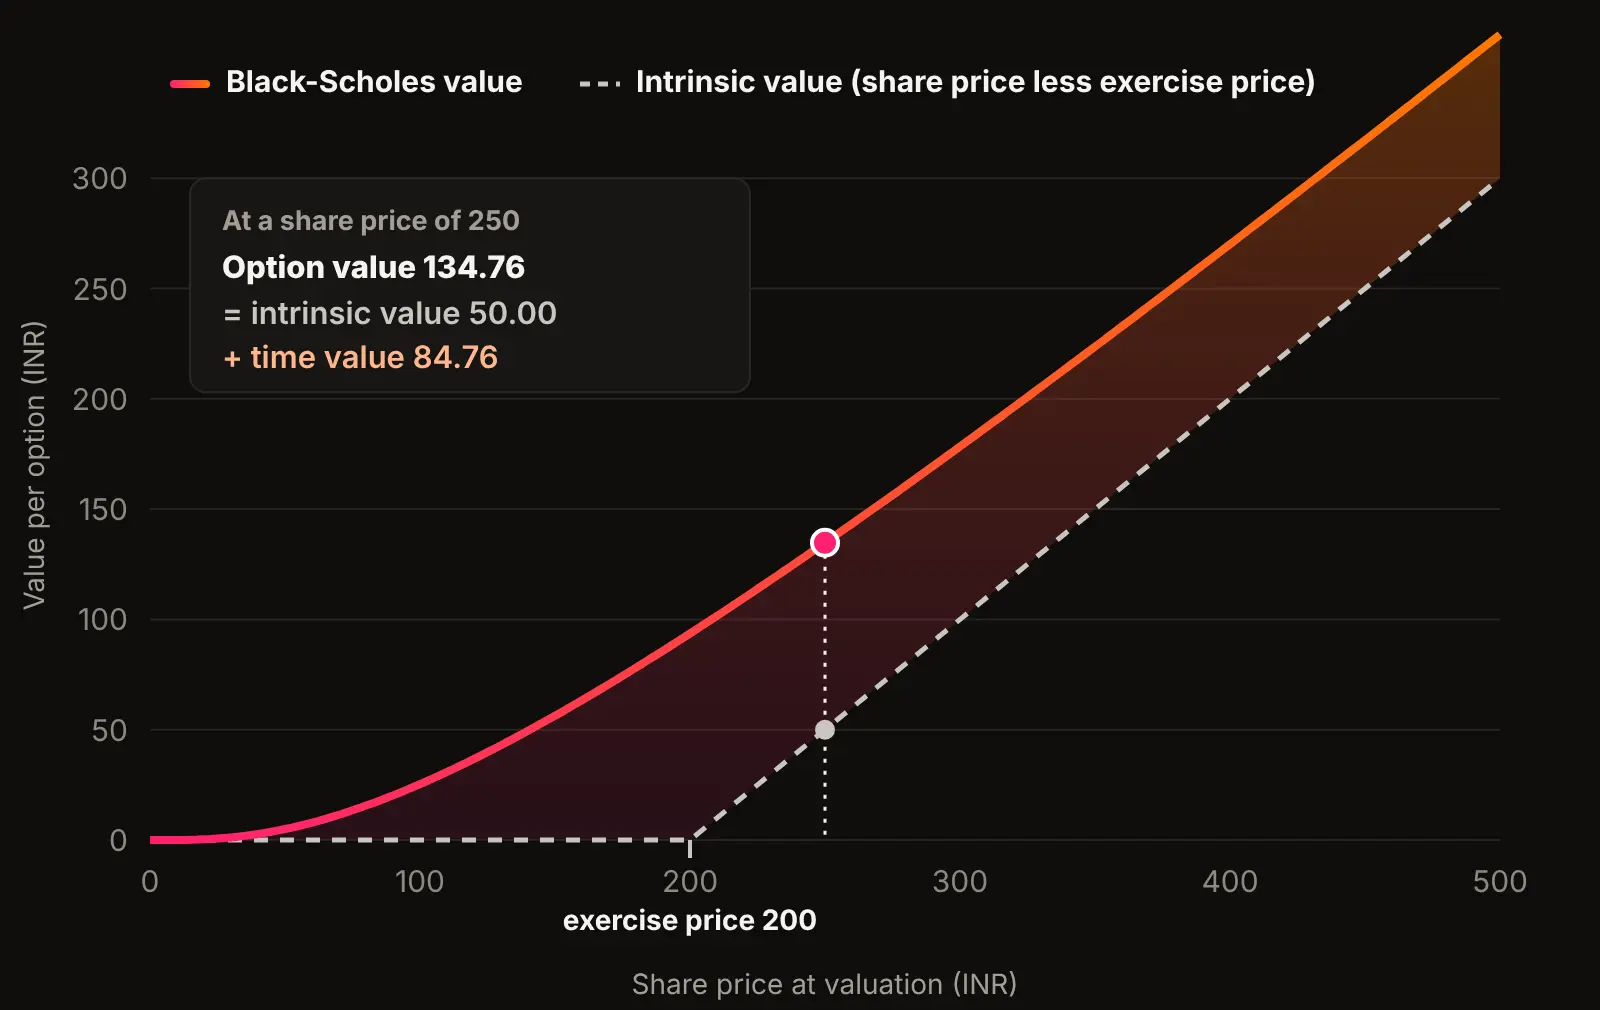
| Intrinsic value of an option | Share price less exercise price, or zero if that is negative | A quick check of what the option would be worth if exercised today |
| Fair value of an option | Intrinsic value plus time value, from an option pricing model such as Black-Scholes | The share-based payment expense, financial statement disclosures, and the reward value of a grant |
Which accounting standards require an ESOP fair value
The model is not tied to one country. IFRS 2, Share-based Payment, is the international standard, used wherever companies report under IFRS. Ind AS 102 is India's converged version of IFRS 2, so the valuation approach is the same. US GAAP covers the topic in ASC 718, Compensation, Stock Compensation. All three require share options to be measured at fair value using an option pricing model, and none of them names a model, but Black-Scholes is the usual choice for options that vest with continued service.
The standards differ in the details around the valuation rather than in the model itself: how the expense is spread across a graded vesting schedule, whether forfeitures are estimated up front, and what shortcuts private companies may take. Those differences are covered below. In India, listed companies also disclose their valuation assumptions under the SEBI (Share Based Employee Benefits and Sweat Equity) Regulations, 2021, and companies that do not follow Ind AS account for ESOPs under the ICAI Guidance Note on Accounting for Share-based Payments.
Try this with your own numbers in the calculator ↑
Equity-settled or cash-settled: which date's share price
The date of the share price, and of every other assumption, depends on how the award will be paid.
Equity-settled awards are paid by issuing shares. Most ESOPs work this way. Their fair value is measured once, on the grant date, using the share price, volatility, risk-free rate and expected term as they stood that day. Later movements in the share price never change it. The company expenses that grant-date value over the vesting period, adjusted only for the number of options it expects to vest.
Cash-settled awards pay the employee cash linked to the share price. Cash share appreciation rights (SARs) and phantom stock are the usual examples. Because the company owes cash, the award is a liability, and the liability is measured again at the end of every reporting period and on settlement, with the share price on that date, the remaining term, and current volatility and rates. Each change goes through profit or loss. By the time the award is paid, the liability equals the cash paid out.
| What differs | Equity-settled (ESOPs, share-settled SARs) | Cash-settled (cash SARs, phantom stock) |
|---|---|---|
| Share price used | On the grant date | On each reporting date, and on settlement |
| Other assumptions | As at the grant date | As at each reporting date, with the remaining term |
| Revalued later? | No | Yes, until settled |
| Recorded in | Equity | Liabilities |
| Amount recognised to date | Grant-date fair value × share of the vesting period served × awards expected to vest | Current fair value × share of the vesting period served × awards expected to vest |
Under US GAAP the same split applies: equity-classified awards are measured at the grant date and liability-classified awards are remeasured each reporting date. A private company may choose to measure its liability awards at intrinsic valueinstead of fair value.
In the calculator, choose In cash under How is it settled? The share price becomes the price on the valuation date, the term becomes the remaining term, and the last panel shows the liability to recognise for the service rendered so far.
The formula
The calculator uses the Black-Scholes-Merton formula for a call option with a continuous dividend yield. With the dividend yield set to zero, it is exactly the original 1973 formula.
Value per option = S × e^(−q × T) × N(d1) − K × e^(−r × T) × N(d2)
d1 = [ ln(S ÷ K) + (r − q + σ² ÷ 2) × T ] ÷ (σ × √T)
d2 = d1 − σ × √T
| Symbol | Input | Unit |
|---|---|---|
| S | Share price on the measurement date | Per share, in the award currency |
| K | Exercise price | Per share, in the award currency |
| T | Expected term, or remaining term for cash-settled awards | Years |
| σ | Expected volatility | % a year |
| r | Risk-free rate, treated as continuously compounded | % a year |
| q | Expected dividend yield | % a year |
| N( ) | Cumulative standard normal distribution | A probability between 0 and 1 |
Read the formula as two legs. The first, S × e^(−q × T) × N(d1), is the value of the share the holder expects to receive if the option ends up worth exercising. The second, K × e^(−r × T) × N(d2), is today's value of the exercise price they will pay, multiplied by N(d2), the risk-neutral probability that they exercise at all. The option is worth the difference. The calculator shows both legs, along with d1, d2, N(d1) and N(d2), under Model working, so a valuer or auditor can tie the result back line by line.
How each assumption moves the ESOP fair value
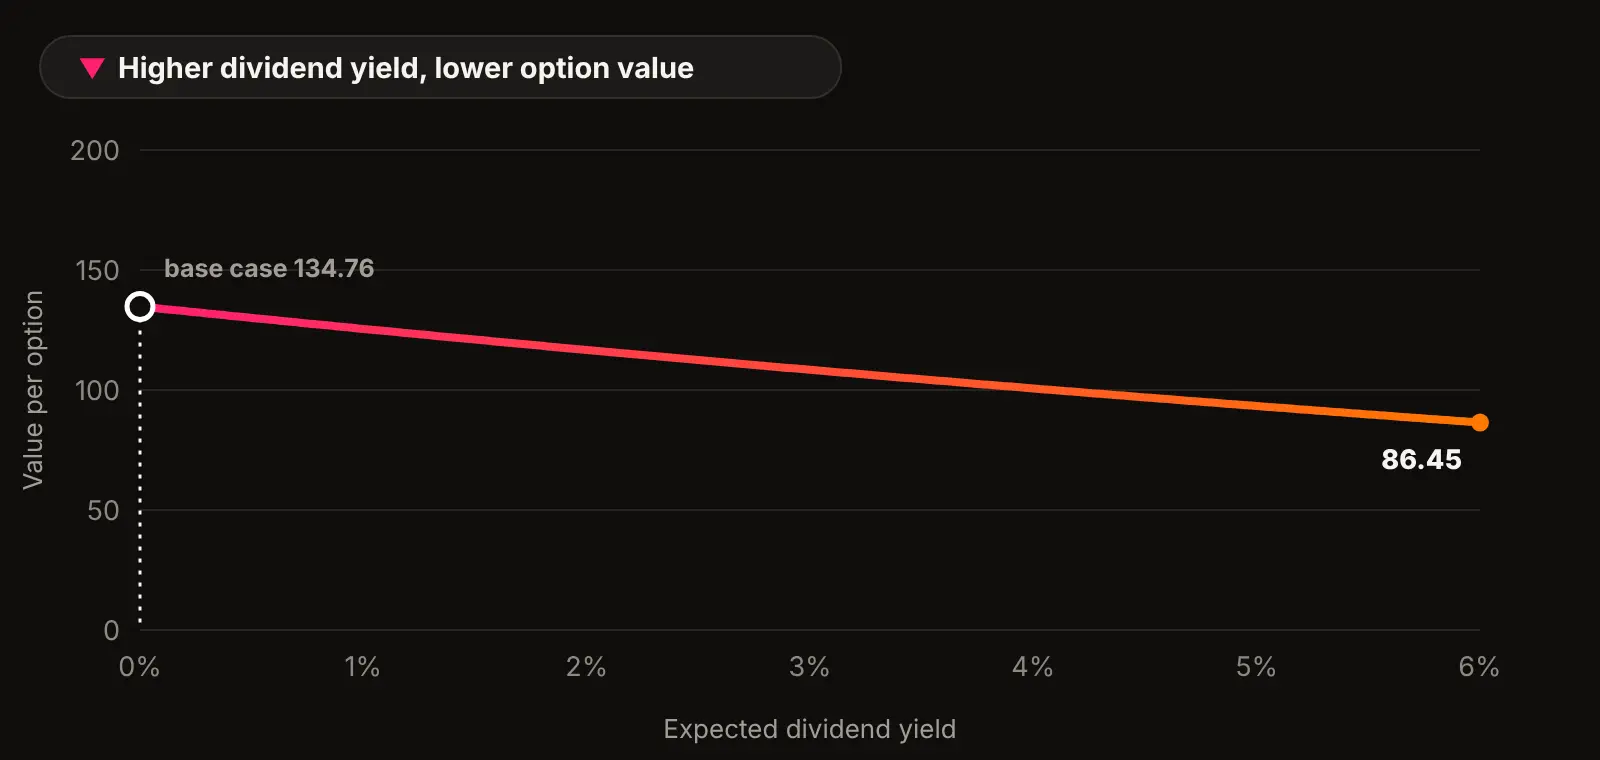
Every input in a Black-Scholes ESOP valuation pushes the option value in a predictable direction, but they do not push with equal force. To see which ones matter, start from one base case and move a single input at a time. The base case used throughout this section is a share price of 250, an exercise price of 200, a 4.5-year expected term, 45% volatility, a 7% risk-free rate and no dividends, which gives a value of 134.76 per option. The figures are the same in any currency.
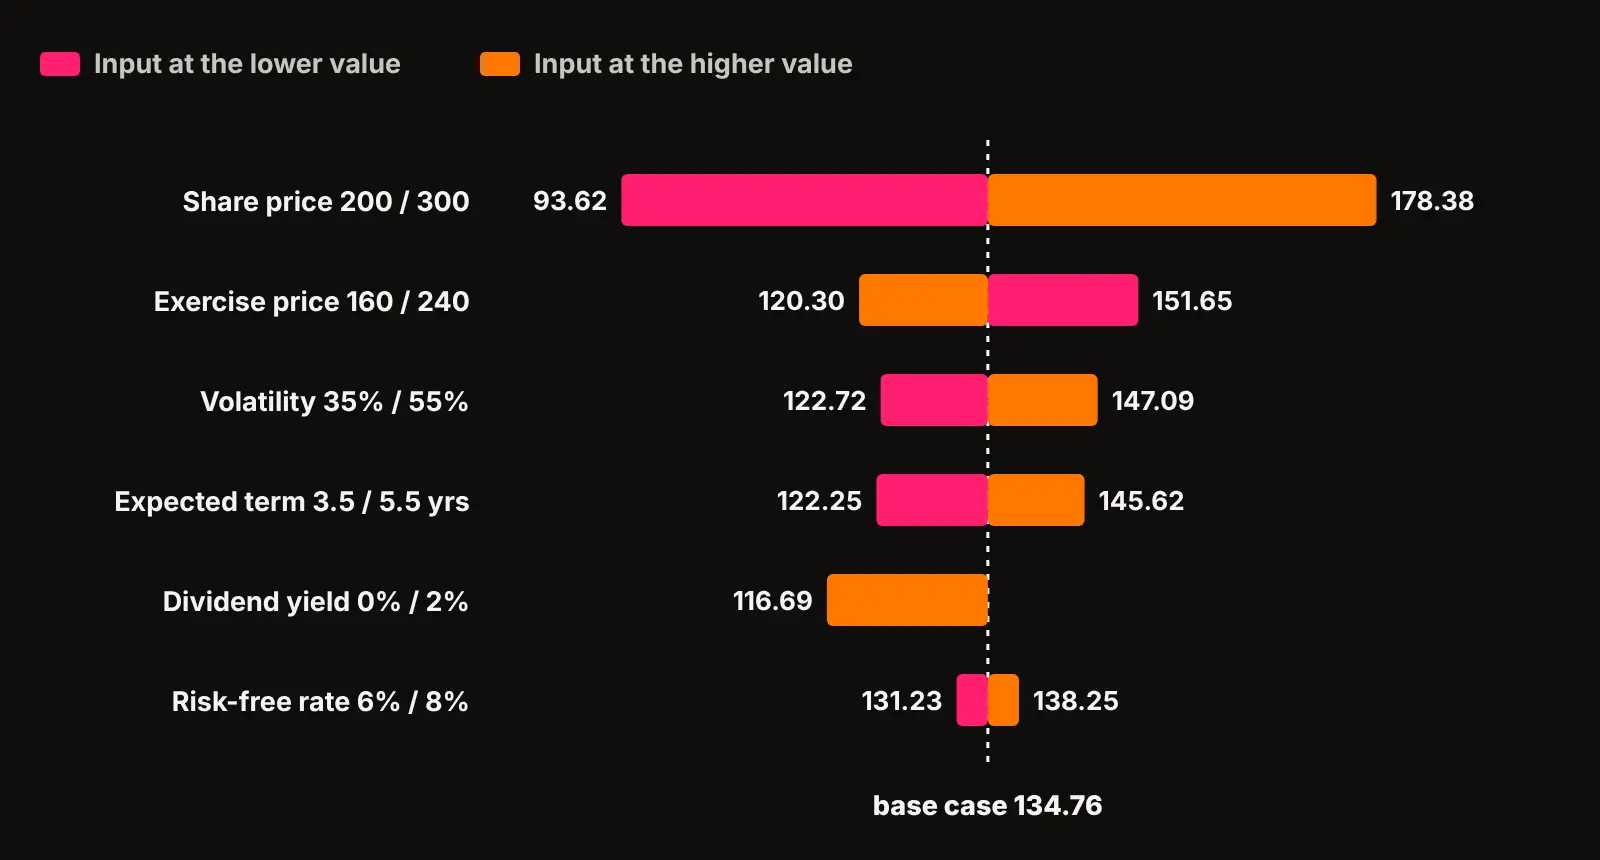
The share price and exercise price are facts on the measurement date, so the real judgement sits with the other four. Of those, volatility and expected term deserve the most care, because a reasonable difference of opinion on either can move the value by close to 10% each way. A whole percentage point on the risk-free rate moves it by less than 3%.
Share price: a higher price means a more valuable option
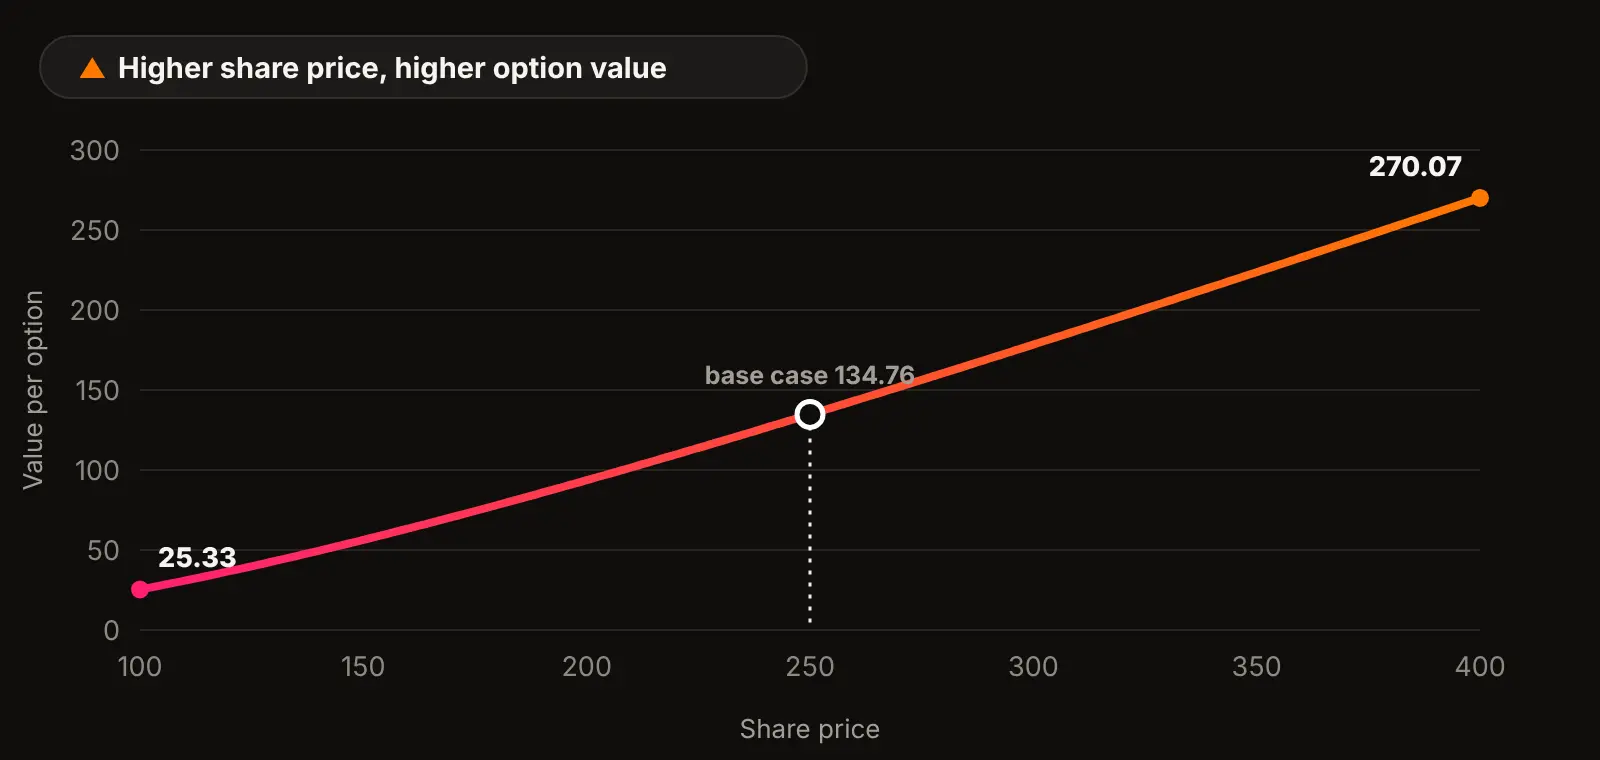
The share price is the anchor of the whole calculation. A higher price puts the option further into the money today and raises the price the share is likely to reach by the time the option is exercised, so the value climbs. The climb is not a straight line. When the option is well out of the money, a higher share price adds only a little, because exercise still looks unlikely. Once it is comfortably in the money, the option value rises almost one for one with the share price, and the option starts to behave like the share itself.
Exercise price: a higher price means a less valuable option
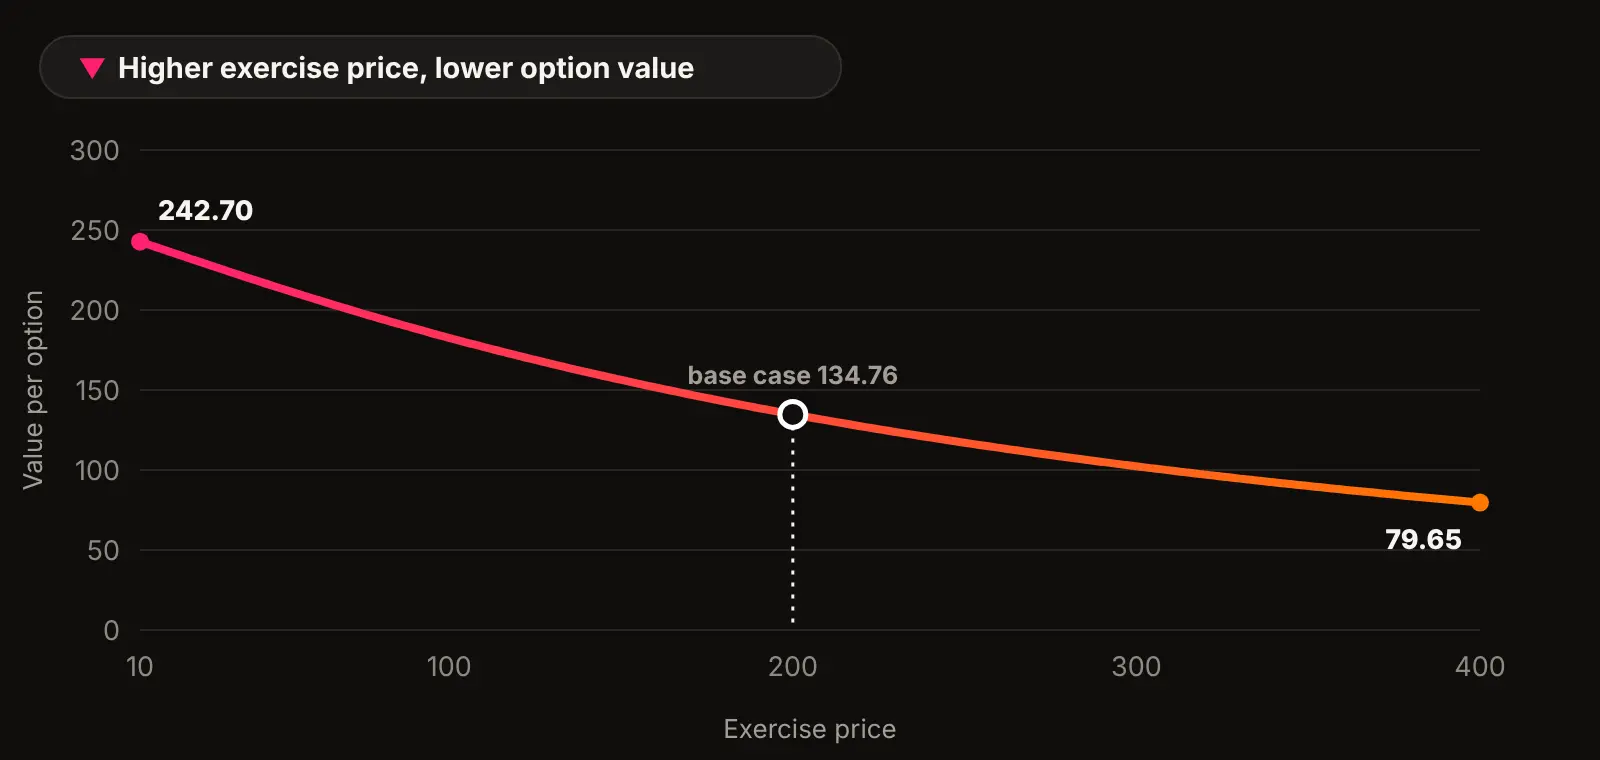
The exercise price is what the employee pays to buy the share, so every increase in it takes value away. How the exercise price is set also changes how the option behaves. An option granted far below the share price, for example at face value, is worth nearly the share price less today's value of the small exercise price, and the other assumptions barely matter. An option granted at or near the market price has little or no intrinsic value, so almost all of its worth is time value, and that time value depends heavily on volatility and term.
Expected term: a longer term usually means a more valuable option
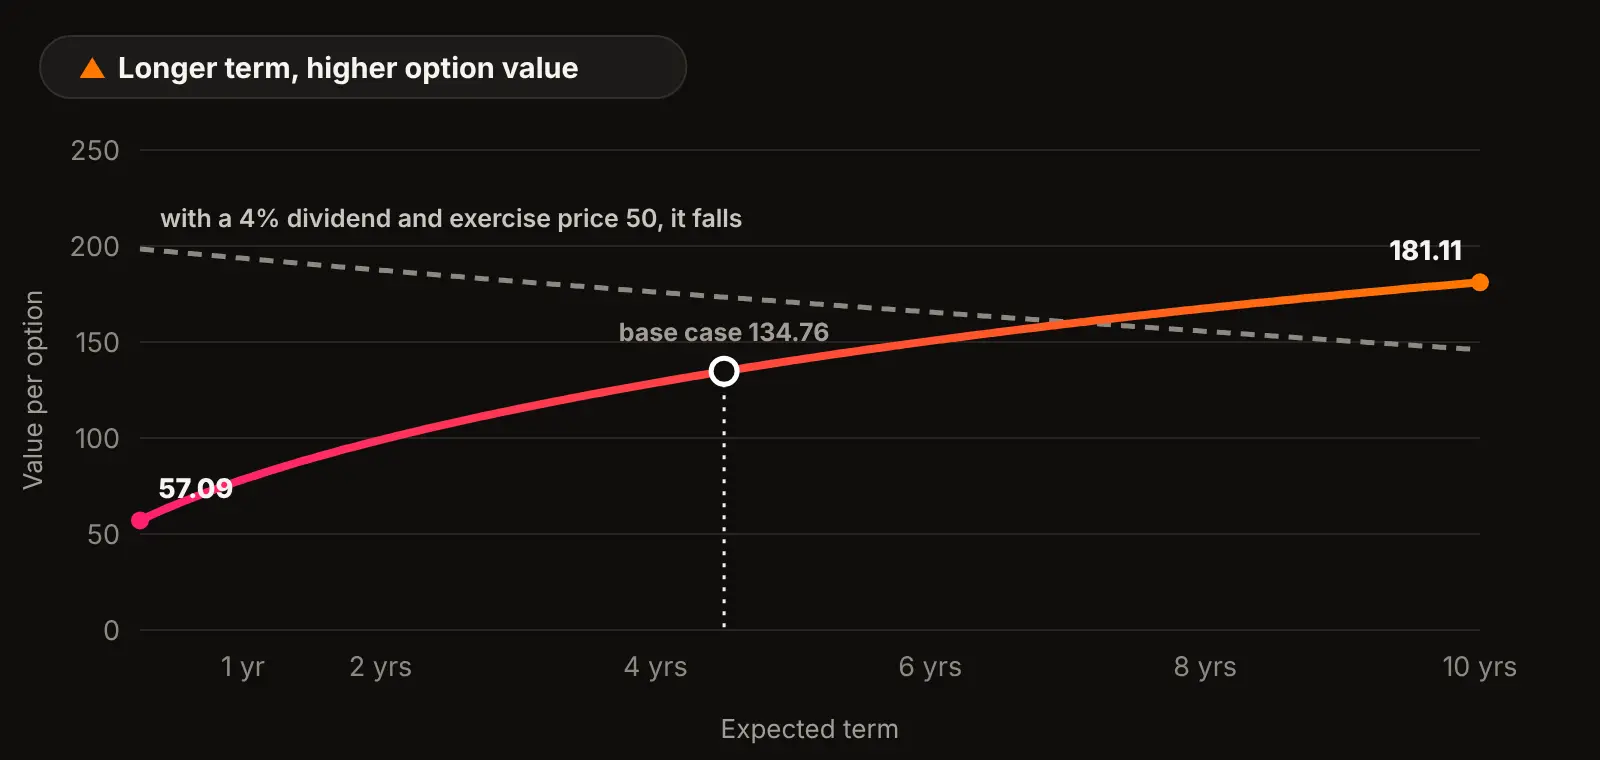
A longer expected term gives the share price more time to rise, and it pushes the payment of the exercise price further into the future. Both add value. The gain is steepest over the first few years and then flattens, so the difference between a one-year and a three-year term is far larger than between an eight-year and a ten-year term. The exception is a company that pays dividends. Option holders miss every dividend paid before they exercise, so for an option deep in the money with a meaningful dividend yield, a longer term can reduce its value.
For employee options, the expected term can never be shorter than the vesting period, and it is usually well short of the contractual life, because employees tend to exercise early, often when they leave or when they can sell.
Volatility: higher volatility always means a more valuable option
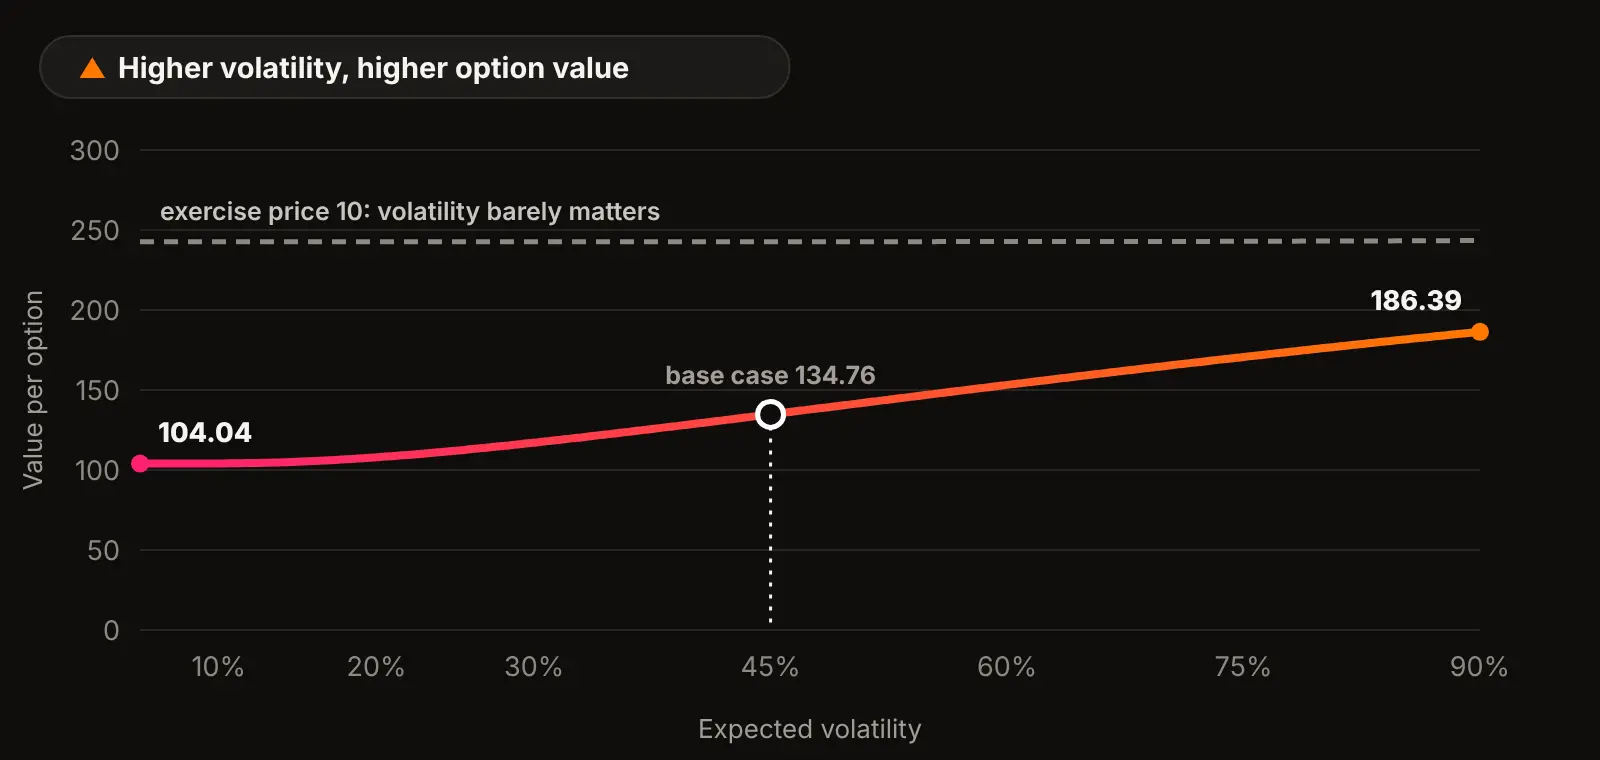
Volatility measures how widely the share price could move over a year. For a shareholder that cuts both ways, but an option holder keeps the upside and walks away from the downside, so a wider spread of possible outcomes is always worth more. That makes volatility one of the most important assumptions and, for an unlisted company that has to borrow it from listed peers, often the most debated.
Its effect depends on where the option sits. Near the money, volatility drives most of the time value. Far in the money, it hardly matters: an option granted at face value is worth about the same at 10% volatility as at 90%. At very low volatility the value settles at a floor of the share price less today's value of the exercise price.
Risk-free rate: a higher rate means a slightly more valuable option
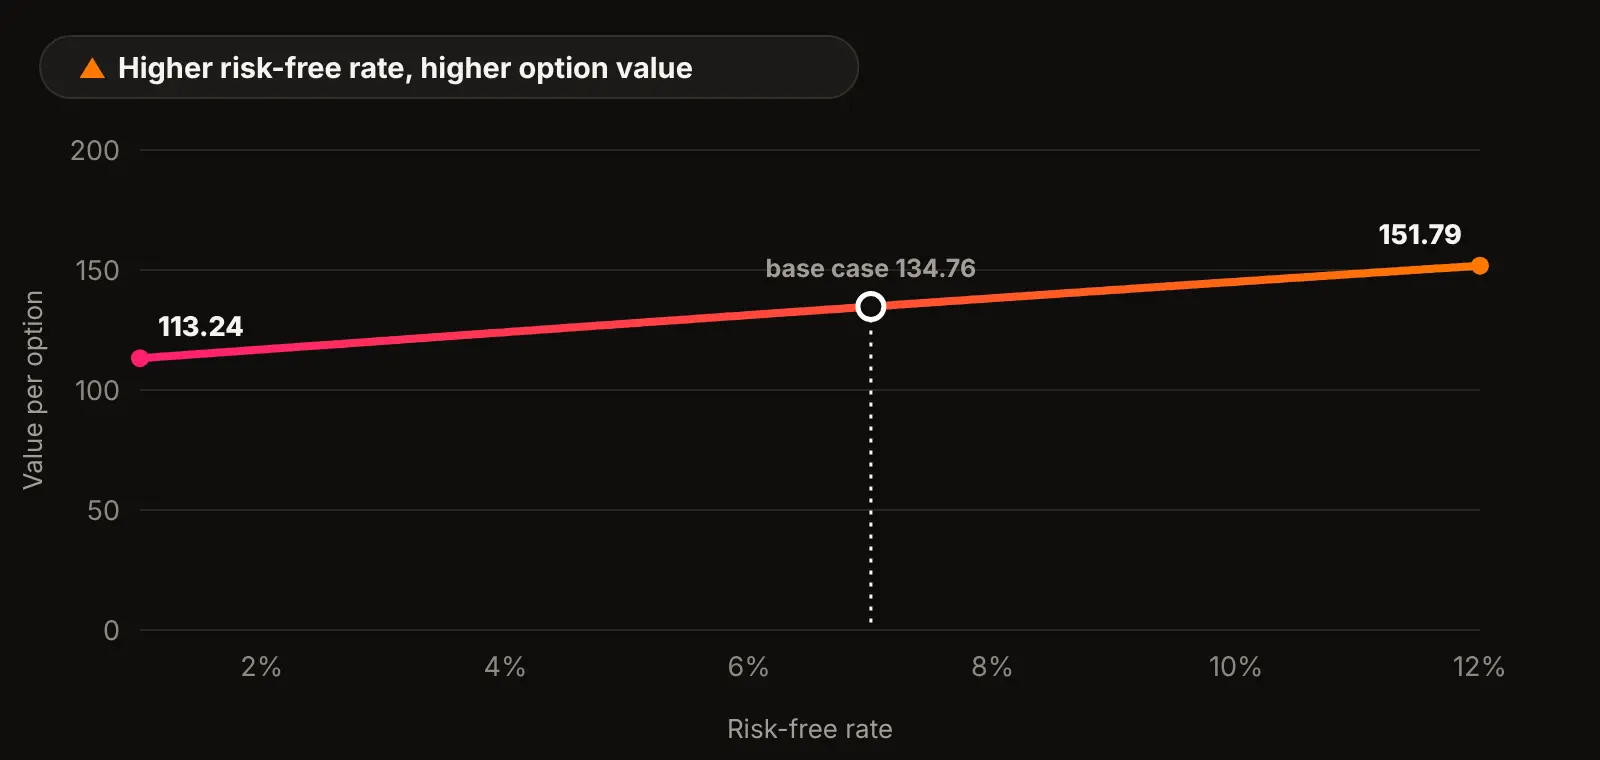
The holder pays the exercise price only at the end. The higher the risk-free rate, the less that future payment is worth in today's money, so the option is worth a little more. In most valuations it is the least influential input: moving it a full percentage point changes the base case by about 3.5 either way. It still needs to be right, and right means the zero-coupon government bond yield in the currency of the exercise price, for a term matching the option's expected term, on the measurement date.
Dividend yield: higher dividends mean a less valuable option
Shareholders receive dividends; option holders do not, until they exercise and become shareholders. Every dividend paid in the meantime takes value out of the share that the option holder never sees, so expected dividends reduce the option's value, and the longer the term, the more they take. A 2% yield cuts the base case from 134.76 to 116.69. Most startups pay nothing and enter zero. The exception is an award that pays dividend equivalents to the holder, as some restricted stock unit plans do; then the holder is not missing out, and no reduction is needed.
At a glance
| When this rises | Option value | How strongly |
|---|---|---|
| Share price | Rises | Strongly; almost one for one once deep in the money |
| Exercise price | Falls | Strongly |
| Expected term | Usually rises | Strongly at first, then less; can fall if dividends are high |
| Volatility | Always rises | Strongly near the money, barely when deep in the money |
| Risk-free rate | Rises | Mildly |
| Dividend yield | Falls | Moderately, more over long terms |
Where each ESOP valuation input comes from
| Input | How it is usually estimated |
|---|---|
| Share price | Listed: the closing price on the measurement date. Unlisted: an independent valuation of the ordinary share, such as a registered valuer's report in India or a 409A valuation in the US |
| Exercise price | From the plan and grant letter. In India it cannot be below the share's face value, since the Companies Act, 2013 does not allow shares to be issued at a discount |
| Expected term | Past exercise behaviour; the midpoint of vesting and expiry; or, for unlisted companies, the expected time to a liquidity event |
| Volatility | Listed: the company's own historical volatility over a period matching the term. Unlisted or newly listed: the median of comparable listed companies |
| Risk-free rate | Zero-coupon government bond yield in the currency of the exercise price, for the expected term |
| Dividend yield | The expected dividend policy over the term; zero for most startups |
Share price
For a listed company, this is the market price on the measurement date. For an unlisted company it is the value of one ordinary share on that date from an independent valuation. It is not necessarily the price of the last funding round, which is usually paid for preference shares with rights that ordinary shares do not carry.
Expected term
Two methods are common for options that vest with service. The midpoint method assumes exercise halfway between the vesting date and the end of the exercise period. The liquidity event method, popular with unlisted companies, assumes employees exercise when they can actually sell, at an expected IPO, buyback or secondary sale. US GAAP allows a similar midpoint shortcut in some circumstances; IFRS 2 has no formal shortcut, so the estimate needs support. The calculator's By vesting tranche mode offers both methods.
Volatility
Volatility is the annualised standard deviation of the share's continuously compounded returns. A listed company with enough history measures its own from daily prices over a period that matches the expected term, then annualises it by multiplying by the square root of about 252 trading days. An unlisted company picks a set of comparable listed companies, measures each one the same way, and takes the median. Periods distorted by one-off events deserve a second look before they are included. Under US GAAP, a private company that cannot estimate its own volatility may use the historical volatility of a suitable industry index instead; IFRS 2 has no equivalent.
Risk-free rate by currency
The rate comes from government bonds in the currency of the exercise price, with a remaining term equal to the option's expected term. Where a zero-coupon curve is published, use it; otherwise the yield on a government bond of matching term is a reasonable proxy.
| Currency | Usual source |
|---|---|
| INR | Government of India securities. CCIL publishes a zero-coupon yield curveevery business day. On 22 October 2026 it implied about 6.3% for one year, 6.9% for three, 7.1% for five and 7.3% for seven |
| USD | US Treasury securities, using zero-coupon (STRIPS) yields or the Treasury yield curve |
| EUR | AAA-rated euro area government bonds, such as German Bunds |
| GBP | UK gilts; the Bank of England publishes a zero-coupon curve |
| SGD | Singapore Government Securities |
| AED, SAR | Local government bonds where a matching term exists. Both currencies are pegged to the US dollar, and valuers often refer to US Treasury yields where the local curve is thin; agree the approach with your auditor |
| AUD | Australian Commonwealth Government Securities |
| CAD | Government of Canada bonds |
The calculator treats the rate as continuously compounded, which is how the formula is written and how it is commonly applied. Converting a 7% annual yield to its continuous equivalent gives about 6.77%, which lowers the value only slightly. A valuer will state which convention they used.
Dividend yield
Base it on the company's expected dividend policy over the term, not only on the past. A company that pays no dividend and has no plan to should enter zero.
Why each vesting tranche is valued separately
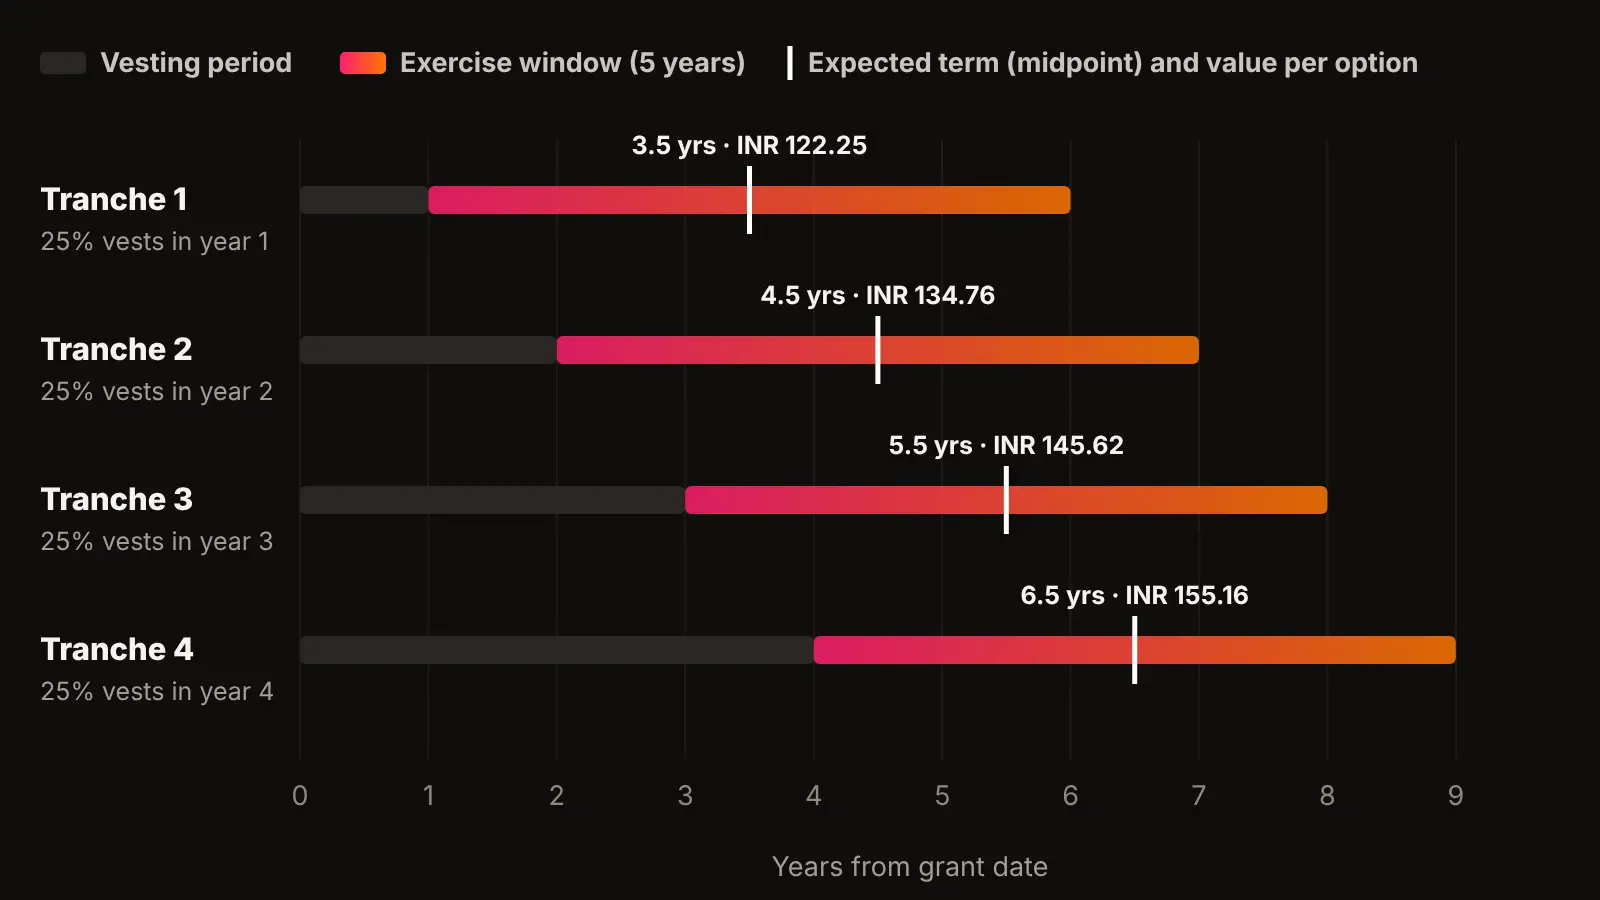
Most ESOP plans vest in instalments, for example 25% a year over four years. In India, the rules require at least one year between grant and vesting, both under the Companies Act for unlisted companies and under the SEBI regulationsfor listed ones. Each tranche vests on a different date, so each has a different expected term and therefore a different fair value. A single blended term understates the later tranches and overstates the earlier ones.
How the expense is spread
IFRS 2 and Ind AS 102 treat a grant with graded vesting as several separate awards, one for each tranche, and expense each tranche over its own vesting period. The first tranche is fully expensed in year one, while the fourth is spread across four years, so the cost falls most heavily at the start: in a four-year annual schedule, roughly half the total lands in year one. US GAAPallows that pattern too, and also lets companies whose awards vest only with service spread the whole cost on a straight line, provided the cost recognised by any date is at least the value of the tranches already vested. The calculator shows either pattern.
The expense also depends on how many options are expected to vest. Leavers do not reduce the fair value per option; instead the number of options is adjusted. IFRS 2 and Ind AS 102 require the company to estimate expected forfeitures and true them up each year, while US GAAP lets a company choose between estimating them and recording them as they happen. The calculator assumes every option vests, so apply your expected attrition to its figures.
A worked ESOP valuation example
An unlisted software company grants 4,000 options to an employee. The exercise price is ₹200 a share, and a registered valuer puts the share at ₹250 on the grant date. The options vest 25% a year over four years, starting one year after grant, and each tranche can be exercised within five years of its vesting date. The company uses 45% volatility from its listed peers, a 7% risk-free rate and no dividends. The options will be settled in shares, so this is an equity-settled valuation at the grant date.
| Tranche | Vests | Expected term | Value per option | Fair value of 1,000 options |
|---|---|---|---|---|
| 1 | Year 1 | 1 + 5 ÷ 2 = 3.5 years | ₹122.25 | ₹1,22,245 |
| 2 | Year 2 | 4.5 years | ₹134.76 | ₹1,34,762 |
| 3 | Year 3 | 5.5 years | ₹145.62 | ₹1,45,615 |
| 4 | Year 4 | 6.5 years | ₹155.16 | ₹1,55,156 |
| Total | ₹139.44 on average | ₹5,57,778 |
Spread by tranche, and assuming every option vests, the cost is about ₹2,76,953 in year one, ₹1,54,708 in year two, ₹87,327 in year three and ₹38,789 in year four.
How the choices change the answer
- Liquidity event instead of the midpoint. If the company expects a liquidity event in five years and uses that as every tranche's term, each option is worth ₹140.37 and the grant ₹5,61,484.
- A rate for each term. Using the zero-coupon rate for each tranche's own term, from about 7.0% to 7.2%, gives ₹5,59,694, about 0.3% more.
- Cash-settled instead. If the same awards were cash SARs, they would be revalued at each reporting date. Eighteen months after grant, with the share at ₹320, the remaining terms are two to five years and the tranches are worth ₹159.23 to ₹202.28 each, of which the company recognises the part matching the service served so far.
- Exercise price at face value. Had the options been granted at a ₹10 exercise price, the 4.5-year tranche would be worth ₹242.70 an option, almost the full share price.
To check these figures, open By vesting tranche in the calculator and enter 4,000 options, 250, 200, 45% volatility, 7% risk-free rate, 4 tranches vesting after 1 year and every 1 year, and a 5-year exercise period. Switch the currency to see the same result grouped in thousands rather than lakhs.
Where Black-Scholes falls short
- One exercise date. The model values an option exercised on a single date. Employees exercise at different times, and the expected term is the workaround. A binomial (lattice) model can build in early exercise behaviour directly.
- Market conditions. If vesting depends on the share price, for example a target price or a return relative to an index, that condition must be reflected in the fair value. That needs a Monte Carlo simulation, not Black-Scholes.
- Service and performance conditions. Conditions such as staying employed or hitting a revenue target are not part of the fair value. They change the number of options expected to vest instead.
- Unlisted shares. The share price and volatility are both estimates, and the model ignores how hard the shares are to sell. Choosing the expected term carefully matters more here than anywhere else.
- Constant inputs. Volatility and interest rates are assumed fixed for the whole term.
This ESOP valuation calculator is a sound way to estimate, plan and check a valuation. For the numbers in statutory financial statements, most companies rely on a valuation report from an independent valuer.
Fair value is not the tax value
The Black-Scholes value is an accounting number for the company. It plays no part in the employee's tax. In India, when an employee exercises, the perquisite is the fair market value of the share on the exercise date less the exercise price, taxed as salary, and the later gain on sale is a capital gain. Other countries tax options at exercise or vesting under their own rules, again on the share's value at the time rather than the option's fair value at grant. For India, the ESOP tax calculatorworks out what an employee will actually pay.
What to have ready
- How the award will be settled: in shares or in cash.
- The number of options or units and the exercise price, from the grant letter, and the currency they are in.
- The share price on the grant date (equity-settled) or the valuation date (cash-settled).
- The vesting schedule and the exercise period from the plan.
- A volatility estimate, from the company's own price history or a set of listed peers.
- The zero-coupon government bond yield for the currency and expected term.
- The expected dividend yield, which is zero for most startups.
Go back to the calculator fields ↑
Questions people ask
1. Does Black-Scholes work for IFRS 2 and US GAAP as well as Ind AS 102?
Yes. All three require a fair value from an option pricing model and none prescribes one. The differences between them are in how the expense is spread and how forfeitures are handled, not in the valuation formula.
2. Which share price do I use for cash-settled SARs?
The price on each reporting date. The liability is revalued every period until it is paid, using that date's share price and the remaining term, while equity-settled options keep their grant-date value.
3. Which assumption matters most in an ESOP valuation?
Of the estimates, volatility and expected term. A reasonable difference of opinion on either can move the value by around a tenth, while a full point on the risk-free rate moves it by a few per cent.
4. Can the option be worth more than the share?
No. Even with no exercise price at all, an option can be worth at most the share price, less the dividends the holder would miss. That is why grants at face value come out close to the full share price.
5. Is the Black-Scholes value what the employee will receive?
No. It is an estimate of value at the measurement date. What the employee receives depends on the share price when they exercise and sell, less the exercise price and tax.
How Tallect helps
Tallect is a modular Total Rewards platform built by Total Rewards practitioners. The Equity modulesits in the same system as compensation planning, benchmarking, bonus and sales incentives and benefits, so equity data lives next to the rest of the reward picture rather than in a standalone cap table tool.
Grants, vesting schedules, exercises and the valuation inputs behind them are held in one place, so the tranche-by-tranche fair values and expense schedules your auditors ask for come from the same records your employees see, whether the awards are settled in shares or in cash.
Indicative only. The calculator applies the Black-Scholes-Merton formula to the inputs you enter and assumes every award vests. It does not model early exercise, market-based vesting conditions, expected forfeitures or illiquidity discounts. This page is general information, not accounting, valuation, legal or tax advice; for figures used in financial statements, rely on an independent valuer and your auditor.