LTI vs STI: What Is the Difference Between Long-Term and Short-Term Incentives and How to Design Both
What is the difference between LTI and STI? This complete guide covers long-term vs short-term incentives, how each works, how to design both, the right ratio by role, and how they connect to your total rewards strategy.
Make Better Decisions
Most companies have both short-term and long-term incentives. Very few have thought carefully about how they connect.
Annual bonuses get paid. Equity grants are issued. Employees receive both and in many cases, neither is designed deliberately around what behaviour it is trying to drive, which population it is targeting, or how it fits into the broader total rewards picture.
The difference between a well-designed incentive structure and a poorly designed one is not which instruments you use. It is whether those instruments are calibrated to the role's time horizon, communicated in a way employees actually understand, and connected to each other in a total rewards view that makes the complete package visible.
This guide covers everything: what STI and LTI are, how each works, what instruments are available, how to design both effectively, the right ratio by role and seniority, the most common design mistakes, and how to connect both to a total rewards strategy that actually drives the outcomes you are trying to achieve.
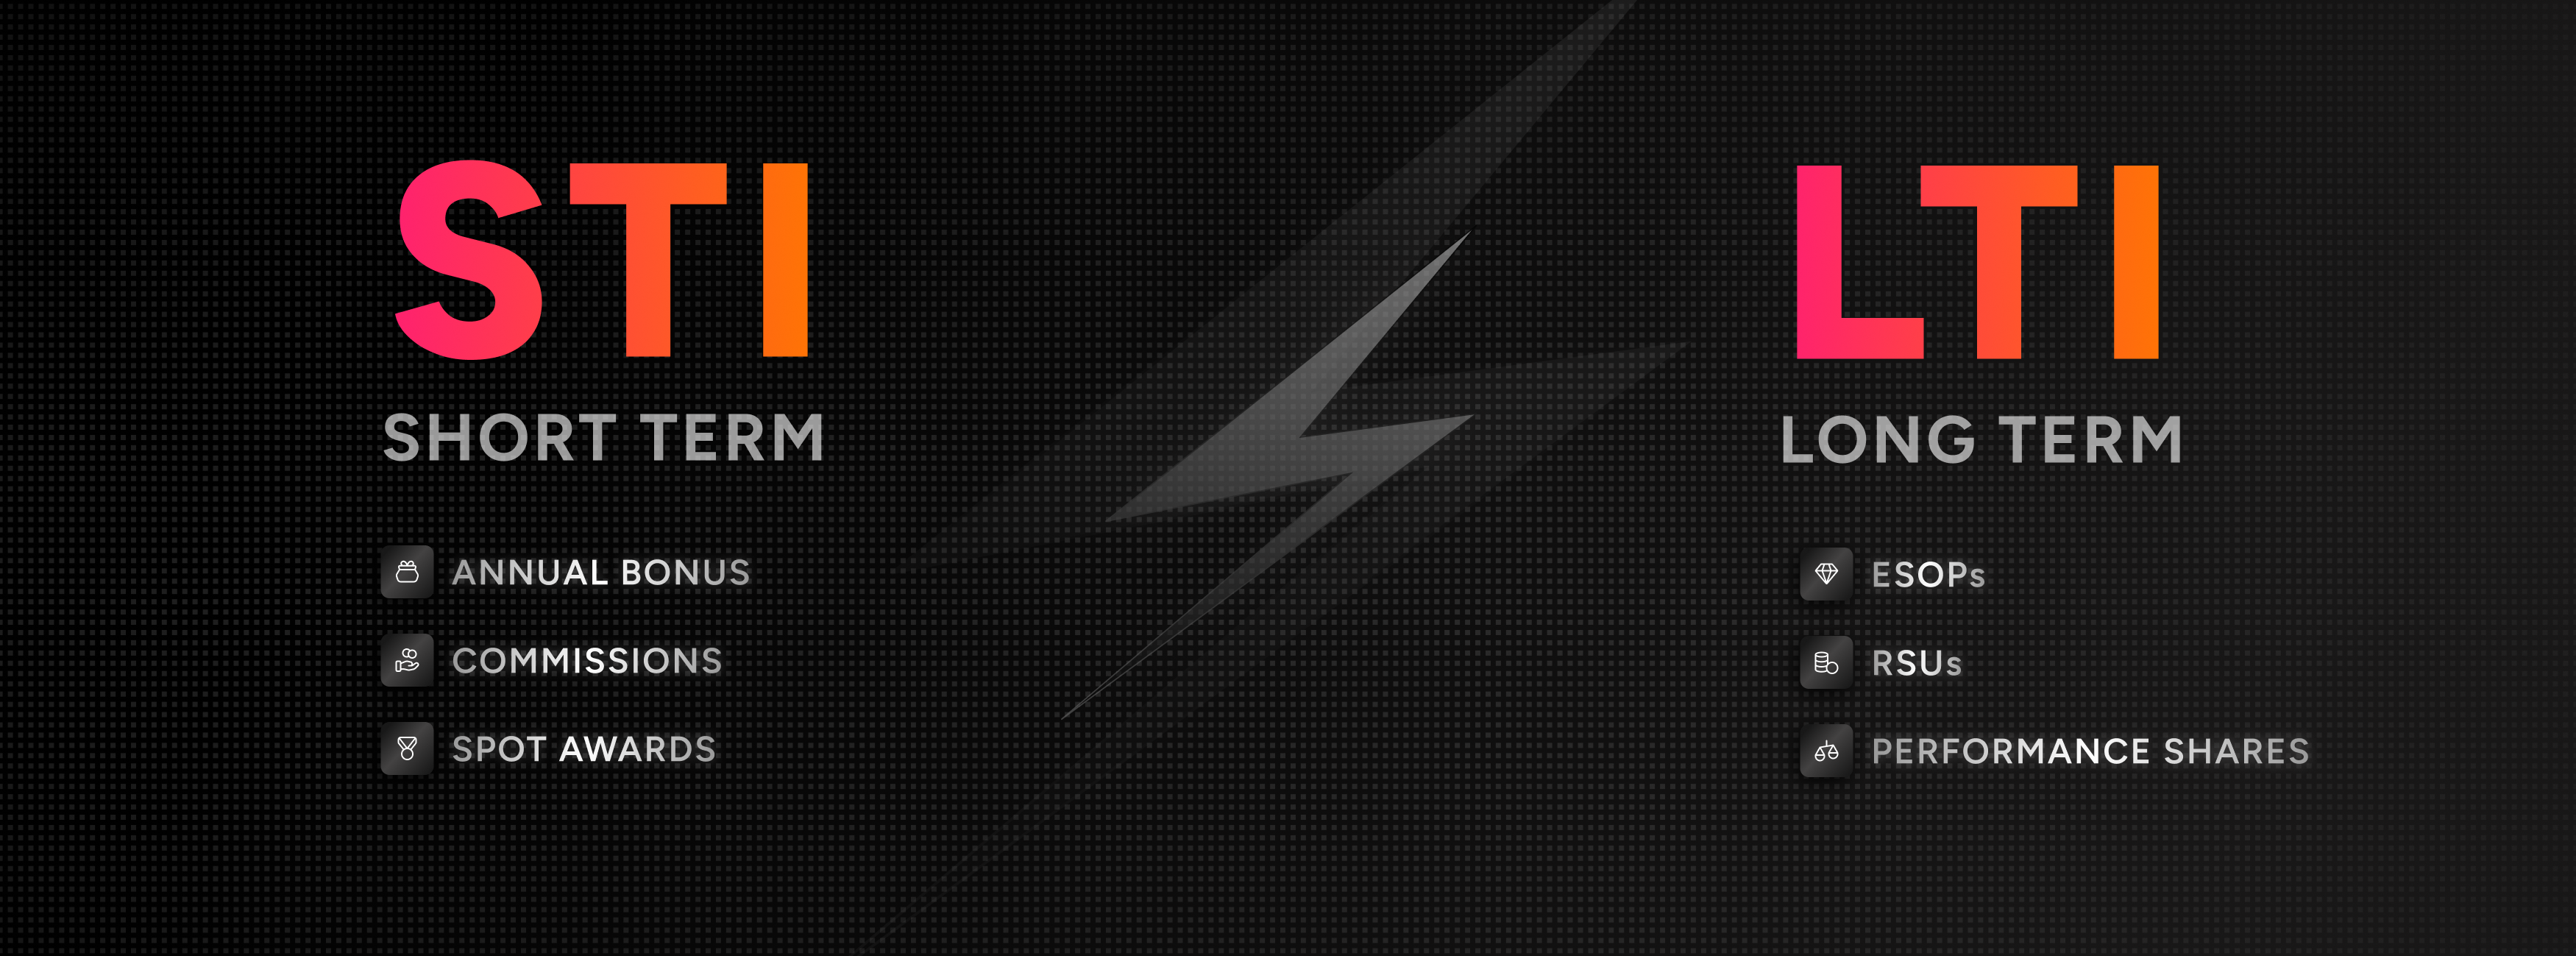
What Is STI? Short-Term Incentive Explained
A Short-Term Incentive (STI) is any variable pay tied to performance measured within a short cycle typically a quarter or a financial year. STI is cash-based, near-term, and performance-contingent. The employee receives more when specific measurable targets are met or exceeded, and receives less or nothing when they are not.
STI exists because of a fundamental principle in behavioural economics: the closer the reward is to the behaviour, the stronger the motivational effect. An annual bonus paid in March for performance delivered in the preceding year is a significantly weaker motivator than a quarterly commission paid within 30 days of the sale it rewards.
Common STI Instruments
- Annual performance bonus — A lump sum paid once a year based on individual, team, or company performance against pre-agreed targets. The most widely used STI instrument globally across all seniority levels.
- Quarterly bonus — Similar to annual bonus but with a shorter performance cycle. Higher motivational frequency more immediate feedback loop between performance and reward.
- Sales commission — A percentage of revenue or margin generated by the salesperson, paid monthly or quarterly. The purest STI instrument the most direct connection between individual output and reward.
- Spot awards — Discretionary, immediate cash or non-cash recognition for specific contributions. Not tied to a formal performance cycle. High motivational impact because of immediacy.
- Project-based bonuses — One-time payments tied to the successful completion of a specific project or milestone. Common in engineering, consulting, and project-driven organisations.
- Profit sharing — A portion of company profits distributed to employees. Ties STI to company-level outcomes rather than individual performance. Common in employee-owned companies and cooperatives.
What STI Does Well
- Creates a tight feedback loop between performance and reward
- Motivates near-term effort and output across a broad employee population
- Provides flexibility can be adjusted annually to align with changing business priorities
- Supports sales and revenue-generating roles where individual output is directly measurable
- Delivers competitive pay without permanently increasing fixed cost base
What STI Cannot Do
- Retain employees who are willing to sacrifice short-term bonus for a competing offer
- Build the ownership mindset that drives long-horizon decision-making in senior roles
- Create financial alignment between employees and company shareholders over multi-year periods
- Compensate for the loss of unvested equity the golden handcuff effect belongs to LTI
Sources: Pearl Meyer — The Basics of a Short-Term Incentive Plan, July 2025; Bentega — STIPs vs LTIPs, December 2025; Corporate Board Member — Executive Incentive Plan Design, January 2026.
What Is LTI? Long-Term Incentive Explained
A Long-Term Incentive (LTI) is any compensation instrument designed to reward performance and drive retention over a multi-year horizon typically three to five years. LTI is usually equity-based, deferred, and tied to either tenure or performance milestones over an extended period.
LTI exists because certain roles require a time horizon that annual bonus cycles cannot address. A VP of Engineering whose architecture decisions shape product capability two years from now cannot be optimally motivated by a metric that resets every twelve months. An executive whose strategic bets will play out over three to five years needs a reward structure that aligns their personal financial interest with that same time horizon.
LTI also does something STI cannot: it makes leaving expensive. An employee with a significant portion of unvested equity has a financial reason to stay that a competing offer must overcome not just in salary but in the total value of what they would walk away from. This is the golden handcuff effect, and it is the primary retention mechanism in equity-heavy compensation structures.
Common LTI Instruments
- Employee Stock Options (ESOPs) — The right to purchase company shares at a fixed price in the future. Value comes from the company growing above the exercise price. Common in startups and pre-IPO companies. High upside potential but value depends entirely on share price appreciation.
- Restricted Stock Units (RSUs) — Company shares granted for free after vesting. No exercise price required. Always have some value as long as shares are worth something. Increasingly common in listed companies and scale-ups as an alternative to options.
- Performance Shares / Performance Share Units (PSUs) — Equity grants tied to the achievement of specific multi-year performance targets typically revenue, EBITDA, TSR, or ESG metrics. Employees receive shares only if targets are met. Aligns LTI payout with actual long-term value creation.
- Phantom Stock / Stock Appreciation Rights (SARs) — Cash-based instruments that mirror equity value without actual share ownership. Useful in companies where issuing real equity is legally complex — particularly in jurisdictions with share transfer restrictions.
- Long-Term Cash Plans — Deferred cash bonuses tied to multi-year performance or tenure milestones. Lower complexity than equity but lacks the ownership psychology that makes equity-based LTI distinctive as a retention tool.
- Co-Investment Plans — Senior leaders invest their own capital alongside company equity. Creates strong alignment because the leader has personal financial skin in the game beyond their compensation.
What LTI Does Well
- Retains key talent by making departure financially costly
- Creates ownership mindset employees who hold equity think like shareholders
- Aligns senior employee interests with long-term company performance and shareholder returns
- Builds multi-year financial wealth for employees in ways cash compensation cannot
- Attracts talent at companies that cannot match market cash compensation particularly at growth-stage companies
What LTI Cannot Do
- Motivate near-term performance with the immediacy that STI provides
- Work as a retention tool if employees do not understand, value, or trust the equity they hold
- Deliver value to employees at companies that never reach a liquidity event
- Replace competitive base salary and STI for employees with significant near-term cash needs
Sources: HRSoft — Long-Term Incentive Plans Comprehensive Guide, May 2026; Everstage — Long-Term Incentive Compensation Plan, July 2025; Corporate Board Member — Executive Incentive Plan Design, January 2026.
LTI vs STI: The Full Comparison
Sources: Bentega STIPs vs LTIPs 2025; Pearl Meyer STI Basics 2025; Super Business Manager — STI and LTI for Executives; HRSoft LTI Guide 2026.
How to Design an Effective STI Programme
Most STI programmes underdeliver not because the instrument is wrong but because the design is poorly executed. The five design decisions that most determine whether an STI programme motivates or merely pays.
1. Define the Performance Metrics Before the Cycle Starts
The single most important rule in STI design: the metrics must be agreed, communicated, and understood before the performance period begins not determined or adjusted mid-year. When targets shift or metrics are reinterpreted after performance has been delivered, the motivational effect of the programme collapses and the bonus becomes a leadership credibility issue rather than a reward.
Good STI metrics are specific and measurable, within the employee's influence or control, connected to genuine business outcomes rather than activity metrics, and structured with a threshold (below which no payout occurs), a target (the expected performance level), and a maximum (the stretch goal above which payout is capped).
2. Calibrate the Payout Curve
The shape of the payout curve determines the risk/reward profile of the STI for the employee. A linear curve pays proportionally 90% performance gets 90% of target bonus. A convex curve accelerates payout above target. A concave curve decelerates below it.
The most common mistake in STI payout design is setting the threshold too low meaning almost everyone receives a meaningful bonus regardless of performance which converts the STI into a fixed cost that carries none of its motivational value. The threshold should represent a level of performance that is genuinely below expectations, not a deliberate safe floor.
3. Determine Eligibility and Target Percentages by Level
Not all employees should be on the same STI target percentage. A percentage of salary approach where target bonus is expressed as a percentage of base salary allows the STI to scale with seniority without requiring constant redesign.
Source: Corporate Board Member — Executive Incentive Plan Design, January 2026; Pearl Meyer STI Basics 2025.
4. Balance Individual, Team, and Company Metrics
Pure individual performance metrics create incentives for sub-optimal behaviour people optimise for their metric at the expense of team outcomes. Pure company performance metrics dilute the individual connection between effort and reward. The right balance depends on the role.
For most roles, a weighted combination works best: individual performance (40 to 60%), team or business unit performance (20 to 40%), and company performance (10 to 30%). Sales roles appropriately weight individual output more heavily. Leadership roles weight company outcomes more heavily. Support functions typically weight team and company metrics more than individual targets.
5. Differentiate Between Performers
One of the most common STI design failures is insufficient differentiation between performance levels at payout. When the difference between a strong performer and an average performer is 5% of bonus, the STI delivers no meaningful performance signal. When the top decile earns two to three times the median payout, the differentiation is visible and motivating.
Budget allocation models where the total STI pool is fixed and managers allocate within it create stronger differentiation than matrix-based calculations where individual payouts are computed independently. The manager making deliberate allocation decisions produces more meaningful outcomes than a formula that produces undifferentiated results.
How to Design an Effective LTI Programme
LTI design is more complex than STI design because the instruments are more varied, the tax implications are jurisdiction-specific, and the retention value depends heavily on how well employees understand and value what they hold. These are the five design decisions that most determine LTI effectiveness.
1. Choose the Right Instrument for Your Stage and Structure
The choice of LTI instrument should be driven by company stage, jurisdiction, and employee population not by what is easiest to administer.
2. Design the Vesting Schedule to Match Retention Objectives
The vesting schedule is the primary retention mechanism of LTI. The design should reflect how long you need employees to stay to deliver the value you are paying for.
The global standard is 4-year vesting with a 1-year cliff nothing vests in the first 12 months, 25% vests on the first anniversary, and the remainder vests monthly over years two through four. This structure creates three retention pressure points: the cliff (where leaving means losing all unvested equity), the first anniversary, and the monthly vesting accumulation that makes each month of continued employment financially valuable.
Alternative structures worth considering: a 3-year vest for roles where the competitive market is moving faster than a 4-year retention horizon. Performance-based vesting for senior roles where tenure alone is insufficient equity vests only if specific multi-year targets are hit. Graded vesting (20% per year over 5 years) for companies that want stronger mid-horizon retention pressure.
3. Size Grants Appropriately by Level and Market Benchmark
Grant size should reflect market benchmarks for the role and level, the company's equity pool constraints, the individual's expected tenure impact, and the role's contribution to long-term value creation.
Source: HRSoft LTI Guide 2026; Corporate Board Member Executive Incentive Plan Design 2026.
4. Make Equity Visible and Understandable
The most consistently overlooked element of LTI design is employee communication. An ESOP grant that employees have never had explained, never seen valued in real time, and never been given a realistic liquidity timeline for is not a retention tool. It is a number in a grant letter.
Best-practice LTI communication includes grant letters in plain language that explain every term exercise price, vesting schedule, exercise period, liquidity plan. An employee-facing dashboard showing current vesting status, current value, projected value at different exit scenarios, and the financial cost of leaving at different tenure points. Annual equity update sessions connected to company milestones that translate company performance into what it means for equity value.
The companies that use LTI most effectively as a retention tool are the ones where employees can articulate what their equity is worth, when it vests, and what it would cost them to leave. If employees cannot answer those three questions, the LTI is not working as designed.
5. Plan for Liquidity
Equity only becomes a financial reality for employees at a liquidity event. Companies that issue equity without communicating a realistic liquidity plan or worse, that have no liquidity plan are offering paper wealth that may never materialise.
Liquidity planning does not require a definitive IPO date. It requires honest communication about the company's trajectory, a realistic assessment of likely exit timelines, and for companies with no near-term IPO plan, periodic liquidity options such as buyback programmes or secondary sale opportunities that allow employees to convert some equity to cash before the primary exit.
The Right LTI to STI Ratio: How to Balance Both
Once the design of each instrument is right, the most important question is the ratio what proportion of total variable compensation should be STI versus LTI, and how should that ratio change by role, seniority, and company stage.
The general principle: the closer a role is to long-term business outcomes, the more of its variable pay should be LTI. The closer a role is to near-term, measurable performance, the more should be STI.
Source: Corporate Board Member Executive Incentive Plan Design 2026; Super Business Manager STI and LTI for Executives.
The 7 Most Common LTI and STI Design Mistakes
How LTI and STI Fit Into the Total Rewards Picture
LTI and STI together form the variable pay layer of total rewards sitting above base salary and alongside benefits and recognition. But variable pay only works as a Total Rewards instrument when employees can see all of the layers together.
An employee who receives a competitive base salary, a 20% STI target, and an ESOP grant worth Rs 8 lakhs annualised but can only see their monthly take-home is evaluating their compensation on roughly half the picture. When AI tools benchmark their salary, those tools are also looking at base salary only. The gap between what the company invests and what the employee perceives is where retention loss happens.
Total rewards statements that show every component base salary, STI target and actual, LTI current value and vesting schedule, benefits, insurance, recognition close that gap. They make the full compensation picture visible at the moment when it matters: when an employee is considering a competing offer or evaluating whether the company values them.
For companies managing equity alongside benefits in a total rewards view, the Tallect global ESOP guide covers how to make equity grants actually valuable and visible to the employees who hold them.
For the complete picture of how all Total Rewards components connect, the Tallect complete Total Rewards guide covers compensation, equity, benefits, recognition, and pay transparency in one place.
The Bottom Line
STI and LTI serve fundamentally different purposes in a compensation strategy. STI drives near-term performance with a tight feedback loop between effort and reward. LTI builds long-term alignment and makes leaving financially costly. Neither is a substitute for the other and neither works optimally in isolation.
The companies with the strongest retention and performance outcomes are not the ones that spend the most on variable compensation. They are the ones that have designed STI and LTI deliberately — right instrument for the role, right ratio for the seniority level, right communication so employees understand and value what they hold, and a total rewards view that makes the complete package visible at the moments that matter.
Getting that right does not require being the highest-paying company in your market. It requires being the clearest.
Frequently Asked Questions
Q1. What is the main difference between LTI and STI?
STI (Short-Term Incentive) is variable pay tied to performance within a short cycle typically a quarter or financial year and is usually paid in cash. LTI (Long-Term Incentive) is deferred compensation tied to multi-year performance or tenure, usually delivered through equity instruments like ESOPs or RSUs that vest over three to five years. STI drives near-term performance. LTI builds retention and long-term alignment.
Q2. What are examples of LTI and STI?
Common STI examples include annual performance bonuses, quarterly bonuses, sales commissions, spot awards, and project-based bonuses. Common LTI examples include Employee Stock Options (ESOPs), Restricted Stock Units (RSUs), performance shares tied to multi-year targets, phantom stock, stock appreciation rights, and long-term cash plans with multi-year deferral.
Q3. What is the right LTI to STI ratio for a company?
The right ratio depends on the role's time horizon. Frontline sales roles appropriately weight 70 to 80% of variable pay in STI (commission and bonus) with 20 to 30% in LTI. Senior individual contributors and managers typically split 40 to 60% STI and 40 to 60% LTI. VP and C-suite roles should be weighted 70 to 80% toward LTI because their strategic decisions play out over multi-year horizons that annual bonus cycles cannot capture.
Q4. How does vesting work in LTI programmes?
Vesting is the process by which LTI instruments become fully owned by the employee over time. The global standard is a 4-year vesting schedule with a 1-year cliff meaning nothing vests in the first 12 months, 25% vests on the first anniversary, and the remaining 75% vests monthly over the following three years. If an employee leaves before the cliff, they forfeit all unvested equity. After the cliff, they keep whatever has vested up to their departure date.
Q5. Why do LTI programmes often fail as retention tools?
The most common reason LTI programmes fail as retention tools is that employees do not understand or value what they hold. An ESOP grant that employees cannot explain, cannot see valued in real time, and have no clear timeline for converting to cash is not a retention tool it is a number in a grant letter. LTI only works as designed when employees know what their equity is worth, when it vests, and what it would cost them to leave. This requires employee-facing dashboards, plain-language communication, and regular equity education sessions not just annual grant letters.
Sources and References
- Pearl Meyer. The Basics of a Short-Term Incentive Plan. July 2025. pearlmeyer.com
- Bentega. Short-Term vs Long-Term Incentives: STIPs vs LTIPs Explained. December 2025. bentega.io
- Corporate Board Member. A Comprehensive Look at Executive Incentive Plan Design. January 2026. boardmember.com
- HRSoft. Long-Term Incentive Plans: A Comprehensive Guide 2026. hrsoft.com
- HRSoft. Top Long-Term Incentive (LTI) Systems for 2026. December 2025. hrsoft.com
- Everstage. Long-Term Incentive Compensation: What It Is and How to Design a Plan That Drives Retention. everstage.com
- Super Business Manager. Short-Term Incentives (STI) and Long-Term Incentives (LTI) for Executives. superbusinessmanager.com
- Pearl Meyer. 2024 Pearl Meyer Report — 97% of public companies and 68% of private companies grant LTIs to senior executives.
Disclaimer: This blog is for informational purposes only. Incentive plan design involves complex legal, tax, and regulatory considerations that vary by jurisdiction. Consult qualified legal, tax, and compensation professionals before implementing incentive programmes.