
A practical methodology for market benchmarking
Most pay benchmarking fails at step two. Here is the five-phase process that produces data you can defend in a compensation committee.
Only a minority of HR teams document their benchmarking methodology in writing, according to a 2025 WorldatWork survey (source needed). That matters because undocumented approaches produce inconsistent results year over year. They make it almost impossible to explain why the P75 for a Senior Engineer moved 14% in eighteen months when the inflation rate was 4%. A structured five-phase methodology fixes that.
Compensation benchmarking has a reputation problem. Most people think of it as pulling three salary surveys, averaging the numbers, and calling it done. The companies that actually get it right do something quite different, and the difference shows up not in how many data sources they buy, but in how methodically they work through the problem before they ever open a spreadsheet.
What follows is the practical methodology we see work consistently, described in enough detail that you can apply it to your own organisation regardless of your team size or the tools you currently use.
Why methodology matters
The instinct when you are unhappy with your benchmarking is to buy more data. Another survey subscription, a newer provider, a bigger dataset. But the issue is rarely data volume. Most organisations already have access to enough market data. The issue is the process sitting around that data: which roles get benchmarked, how they get matched to market job families, what percentile target gets set for which role clusters, and how often those decisions get revisited.
Without a documented methodology, you end up with outcomes that vary based on who ran the analysis and when they ran it. A new HR business partner might match your Sales Director to a VP-level benchmark. The previous HRBP matched the same role to a Director level. Both may have been reasonable calls, but the 22% gap in resulting pay range creates problems when the two decisions sit next to each other in a compensation review.
The five phases
1. Scope definition
Before you pull a single data point, decide which roles you are benchmarking, across which geographies, and against which market segment. Scoping sounds obvious but it is where most methodologies break down. You need to decide whether you are benchmarking all roles or just those flagged as hard-to-fill or high-turnover. You need to decide whether a Singapore-based Finance Manager gets compared to Singapore-only data, Southeast Asia data, or APAC data. And you need to be explicit about which company peer group you are targeting for talent, not for product competition.
2. Data source selection
This is the phase most teams rush past. You want at least two independent data sources per role cluster, and you want to understand the vintage of each dataset before you weight it. A compensation survey published in Q4 2025 that collected data in Q1 of that year is already fourteen months stale by the time you use it in your April 2026 cycle. Know the collection date, not just the publication date. For fast-moving roles like AI engineers or growth product managers, you may need to supplement published surveys with real-time offer data from your own ATS or from a live benchmarking feed.
3. Job matching
Job matching is where compensation benchmarking either earns its credibility or loses it. The process of mapping your internal job titles to the standardised job families in a survey requires judgement, documentation, and a consistent set of matching criteria. The two most common criteria are scope of impact (individual contributor versus team lead versus function head) and level of autonomy (execution versus decision-making). Write those criteria down. Create a job matching guide that a new team member could follow and arrive at the same conclusions as a ten-year veteran.
4. Positioning strategy
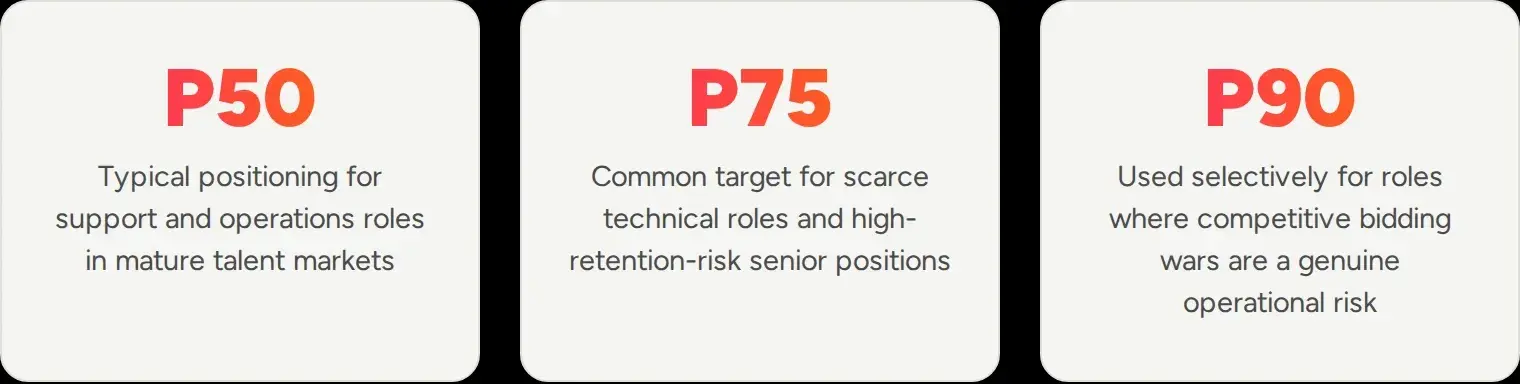
Once you have the market data in hand and your jobs matched, you need to decide where you want to position relative to that market. This is the most political part of the methodology. It is also the one that most often gets skipped, or treated as a finance negotiation rather than a deliberate strategic choice. Positioning at P50 for most roles while targeting P75 for engineering and P90 for commercial functions is a legitimate strategy. The problem is when organisations arrive at those positions accidentally rather than by design.
5. Band setting and communication
The final phase converts market data and positioning decisions into actual salary bands and then decides how much of that analysis gets communicated to employees and managers. Pay transparency norms are shifting fast. In some markets, publishing the full range is now legally required (source needed). In others, it remains discretionary. What is not optional is having bands that are internally consistent and externally defensible, with a clear rationale for why a Senior Data Scientist band starts at X and tops out at Y.
What the data shows about benchmarking maturity
- Only a minority of HR teams have a documented benchmarking methodology, per WorldatWork 2025 (source needed).
- Teams that benchmark quarterly rather than annually are more likely to meet hiring targets (source needed).
- Compensation is the primary reason cited for most offer declines in tech roles, per Gartner 2026 (source needed).
The job matching problem
We said job matching is where benchmarking earns or loses credibility. It is worth unpacking why that is.
Salary surveys organise roles into standardised job families with level descriptors. In one major survey, a Level 4 Software Engineer might be defined as someone with five to eight years of experience who works independently on complex technical problems and mentors junior engineers. Your internal Principal Engineer might match that perfectly. Or they might be operating two levels above it in practice while being titled one level below it in your HRIS.
This mismatch is extremely common. The way to catch it is to anchor matching decisions to scope and impact, not title or years of experience. Title inflation in tech over the past decade has made title-based matching almost useless. A Senior Engineer at a 50-person startup often operates at a Staff or Principal Engineer level by the scope criteria you would apply at a larger organisation.
The question is not what your internal job title is. The question is: what level of decision-making authority and business impact does this role carry? Match to that and your benchmarking holds up under scrutiny.
Automated job matching at scale
Tallect's AI reads your internal job descriptions and maps them to standardised survey job families using scope and impact criteria, not keyword matching. For a 300-role organisation, a manual job matching exercise that would take three weeks gets done in a single afternoon, with every match decision documented and auditable.
A defensible positioning strategy
The positioning phase is where compensation philosophy gets tested against budget reality. In theory, every organisation wants to pay at or above market. In practice, most have to make choices about which roles get P75 treatment and which get P50.
The smarter approach is to segment roles by three factors: strategic importance to the business model, scarcity of supply in the relevant talent market, and attrition risk based on actual flight risk data. A Customer Success Manager in a market with healthy supply and moderate attrition risk can reasonably be positioned at P50. A machine learning engineer in a city where three major tech companies are all hiring simultaneously warrants a different positioning decision.
Document those decisions. Write down why the ML Engineer role is targeted at P75 and why the Customer Success role is at P50. That documentation becomes the basis for conversations with finance, with managers, and with candidates who push back on offer numbers.
Based on your ATS data, current offer acceptance rates, and real-time market movement in each role cluster, Tallect surfaces positioning recommendations per job family. If your acceptance rate for Senior Data Scientists has dropped below 60% in the past 90 days while market rates for that role have moved 8%, the platform flags it before your next compensation review, not after.
How often to run it
The answer depends on the volatility of your talent markets. For most organisations, running the full five-phase process annually and doing a lighter data refresh at mid-year is sufficient for stable roles. For high-volatility roles in fast-moving sectors, a quarterly data check against live market rates is worth the overhead, even if you only reset bands once a year.
The risk of running the full methodology too infrequently is that your bands become disconnected from the market faster than you realise. A band that was correctly set at P75 in January can slip to effectively P55 by December in a hot talent market. By the time you discover the gap at next year's compensation review, you may have already lost five people who felt underpaid and could not get a sensible answer about why.
Continuous band calibration between review cycles
Tallect monitors your published pay bands against live market data throughout the year. When a role cluster's real-world positioning drifts more than 5% from your target percentile, the platform alerts your compensation team so you can make a mid-cycle adjustment before the gap becomes a talent problem. No more discovering you have been underpaying your engineering team at the annual review.

Building it into your calendar
One reason benchmarking methodologies stay undocumented is that they are treated as a project rather than a process. A project gets done once, written up loosely, and then rebuilt from memory next year. A process has an owner, a calendar, defined inputs, and a documented output format.
The practical way to build your benchmarking methodology into a calendar is to anchor each phase to a specific time of year that connects logically to your compensation and headcount planning cycles. A workable rhythm:
- July: scope definition.
- August: data source selection and job matching.
- September: positioning decisions.
- October: band setting.
That timeline gives you calibrated pay bands ready for Q4 headcount planning and your January merit cycle.
Organisations that run their benchmarking on this rhythm tend to see higher offer acceptance rates than those that treat it as an ad-hoc exercise (source needed). When your pay bands are calibrated and current when offers go out, acceptance rates are higher. When they are stale or inconsistently applied, you see declines, counter-offer situations, and last-minute band exceptions that erode the integrity of the whole system.
What good documentation looks like
The output of a properly run benchmarking methodology is not a spreadsheet of market rates. It is a set of decisions with documented rationale. For each role cluster, you want to be able to answer six questions from your documentation:
- Which survey sources were used, and what was the data collection date for each?
- How was this role matched to the market job family, and who made that call?
- What peer group was used, defined by industry, geography, and company size?
- What market percentile are we targeting for this role, and why?
- When was this band last reviewed, and what triggered that review?
- Who approved the final band, and at what level of the organisation?
If you cannot answer those six questions from your documentation, your methodology is not yet complete. The documentation requirement is not bureaucracy. It is what lets a new CHRO, a new compensation lead, or an external auditor pick up where the last person left off without reinventing the wheel.
Frequently asked questions
How many salary surveys do I need?
Two to three well-chosen surveys is generally sufficient for most roles. The quality of your job matching matters more than the volume of data. Using five surveys and matching poorly will produce worse results than using two surveys with rigorous job matching. For niche or senior roles, you may need to supplement survey data with real-time offer data or specialist pay data providers.
How do I handle roles that don't exist in standard survey job families?
Emerging roles like AI Prompt Engineer or Head of Climate Strategy often have no direct survey equivalent. The approach is to match to the closest functional job family. Then apply a premium or discount based on the scarcity and demand signals you can observe from job posting data and hiring difficulty in your own ATS. Document this as a blended methodology and revisit annually as more specific survey data becomes available.
Should I benchmark total compensation or base salary only?
Always benchmark total target compensation, which includes base salary plus target annual bonus plus annualised long-term incentive value. Benchmarking base salary only produces misleading comparisons for any role that carries a bonus, commission, or equity component. The market rate for a VP of Sales means nothing unless you know whether the market number includes the at-target commission or excludes it.
What percentile should we target for pay positioning?
There is no universal answer, and any provider that tells you otherwise is oversimplifying. The right percentile target depends on your talent scarcity for that role, your retention risk data, your available budget, and your overall compensation philosophy. Most organisations use P50 as a baseline and selectively apply P75 to high-priority or high-turnover roles. Very few roles justify P90 on a sustained basis.
How do I benchmark roles where local survey data is thin?
In markets with limited survey coverage, the practical approach is to use regional data as a starting point, then validate against local hiring data from your own ATS and from job posting analysis. Talking to two or three specialist recruiters in that market also provides useful calibration. Some global providers now offer country-specific data for emerging markets that was not available five years ago, so it is worth checking what has changed in your data sources recently.
What is the difference between job matching and job evaluation?
Job matching is the process of aligning your internal roles to external market job families for the purpose of pay benchmarking. Job evaluation is an internal process of ranking roles relative to each other based on factors like complexity, impact, and accountability. The two processes should be consistent with each other but serve different purposes. Job evaluation determines your internal career architecture. Job matching determines where that architecture sits relative to the external market.
How wide should a salary band be?
A common width is plus or minus 20 to 25 percent from midpoint, which gives a total range of roughly 40 to 50 percent from minimum to maximum. Narrower bands work well for highly standardised roles where experience variation is limited. Wider bands accommodate greater variation in skills, performance, and tenure within the same job level. Bands wider than 60 percent often indicate that the level architecture is not defined tightly enough.
How often should we update our salary bands?
Annual updates are the minimum for any organisation. Organisations in fast-moving talent markets, particularly tech, fintech, and climate-tech, benefit from a mid-year data refresh. That refresh checks whether bands have drifted meaningfully from their target percentile without requiring a full band reset. The trigger for an off-cycle update is typically a sustained drop in offer acceptance rate or a spike in voluntary attrition in a specific role cluster.
Should we share our salary bands with employees?
Increasingly, yes. Several jurisdictions now require it at the point of advertising or offer (source needed). Beyond legal compliance, sharing bands with employees reduces the energy spent on pay speculation. It focuses compensation conversations on where someone sits within the band and what would move them through it, which is more productive than arguing over whether the number is fair.
Can a small HR team run a rigorous benchmarking process?
Yes, with the right tools. The constraint is not team size; it is access to good data and a repeatable process. A two-person compensation function with access to a platform that handles job matching, data blending, and band calculation can produce rigorous results. What they cannot do is manually pull and reconcile four survey sources for 200 roles every quarter without automation.
How does Tallect support the benchmarking methodology?
Tallect integrates multiple data sources into a single benchmarking environment, automates job matching using scope-based criteria, and generates band recommendations at your chosen positioning percentile. The platform documents each matching and positioning decision, creating an auditable record that your team can reference and update without starting from scratch each cycle.