
Compa-Ratio Explained: The One Metric Every Compensation Cycle Should Track
One number, one formula - and it will tell you more about the health of your pay structure than almost anything else on the compensation dashboard.
Quick answer:
Compa-ratio measures where an employee's base pay sits relative to the midpoint of their salary range. A ratio of 1.0 means exactly at midpoint - the organization's benchmark for fully competitive, fully proficient pay. Below 0.80 is usually worth a closer look; above 1.20 often signals the role or range needs re-examining. The formula is one line, the interpretation takes judgment, and it reliably surfaces problems - compression, drift, quiet inequity - that don't show up clearly anywhere else.
What compa-ratio actually measures
Compensation dashboards tend to accumulate metrics the way junk drawers accumulate batteries - useful in theory, rarely all used at once. Compa-ratio is the exception.
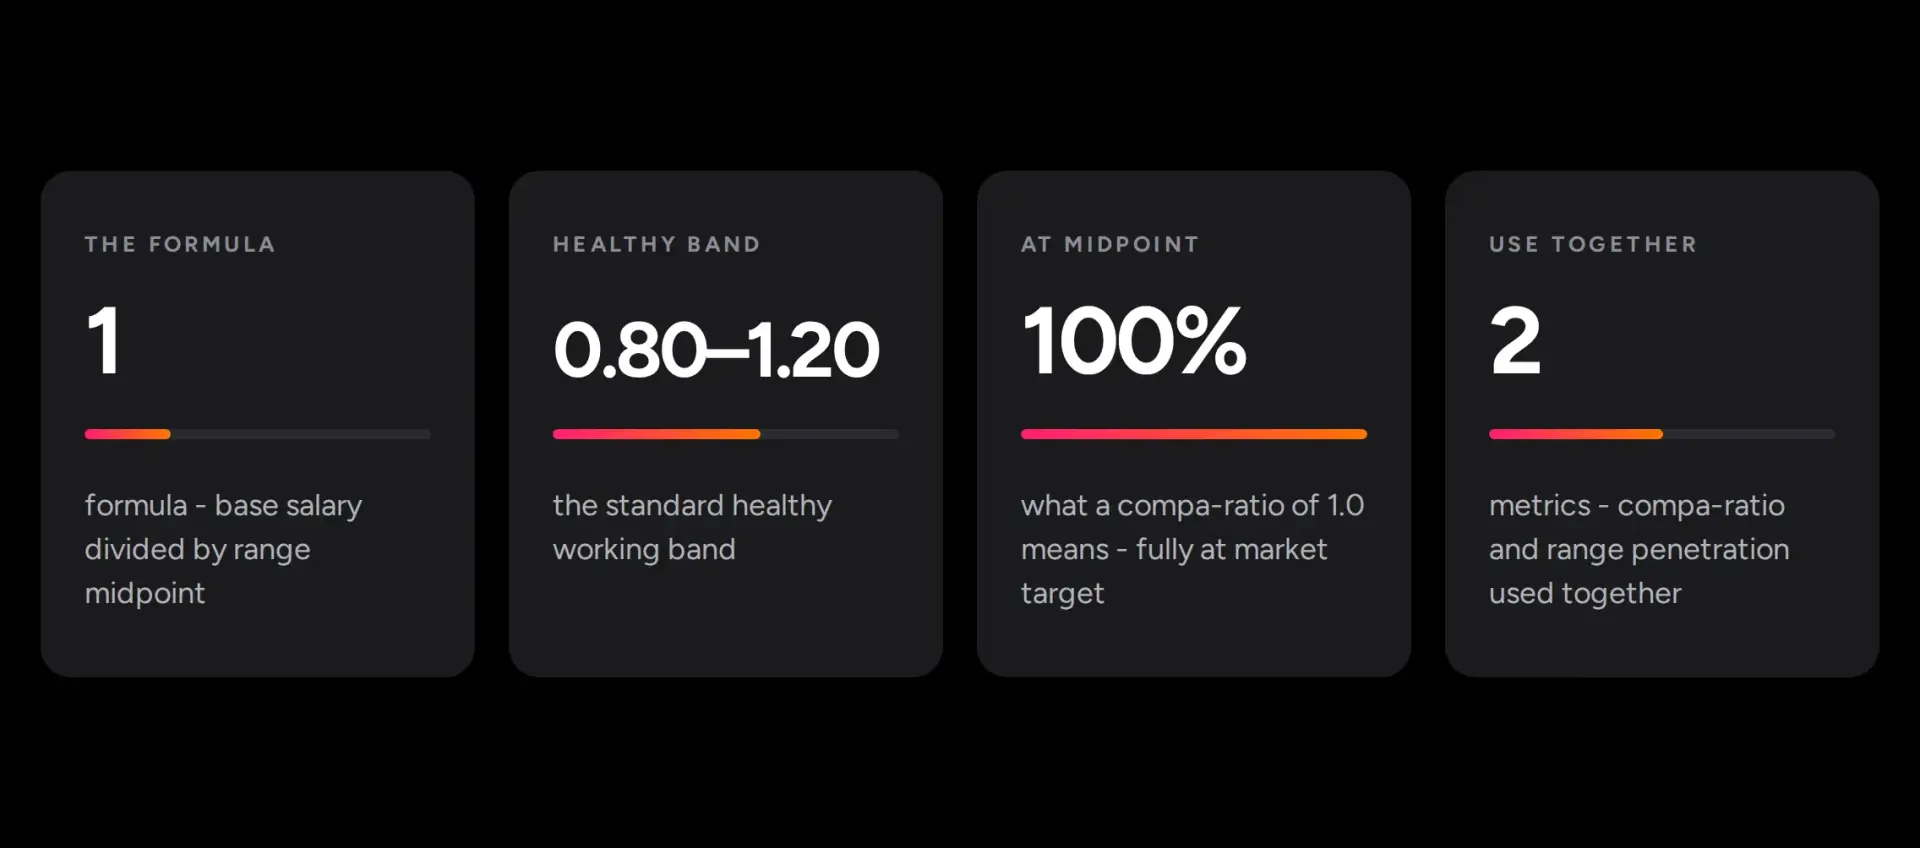
The formula is simple: compa-ratio equals an employee's pay rate divided by the midpoint of their salary range. A result of 1.0, or 100%, means the employee is paid exactly at midpoint - the number the organization has determined represents fully competitive, fully proficient pay for that role. A ratio of 0.90 means 10% below midpoint; 1.10 means 10% above.
That narrowness is intentional. Compa-ratio looks at base salary against one reference point, and its entire value comes from how consistently and clearly that comparison can be applied across an organization. Two employees in the same role with similar tenure and performance can be compared directly. A whole department can be examined in aggregate. A merit cycle can be structured around it.
The reference point - the midpoint - matters. It's anchored to the market through salary surveys, set to represent what the organization should pay for fully proficient performance in that role, in that market. Which means the quality of the midpoint determines the quality of the metric. A stale midpoint produces a compa-ratio that looks precise but measures against an outdated target.
AI insight: live data vs the annual snapshot. The traditional problem with compa-ratio is a timing one. Range midpoints are typically set once a year from salary surveys. So for months after the survey closes, every compa-ratio in the organization is being measured against data that's already aging. A ratio of 0.92 means something different in January, when the data is fresh, than in October, when the market may have moved.
AI-driven benchmarking tools solve this by continuously updating range midpoints as market data shifts. Platforms like Tallect pull from live compensation databases and recalibrate midpoints as the market moves - meaning compa-ratio reflects current conditions rather than last year's survey cycle. The formula stays the same. What changes is the quality of the denominator.
The 0.80–1.20 band
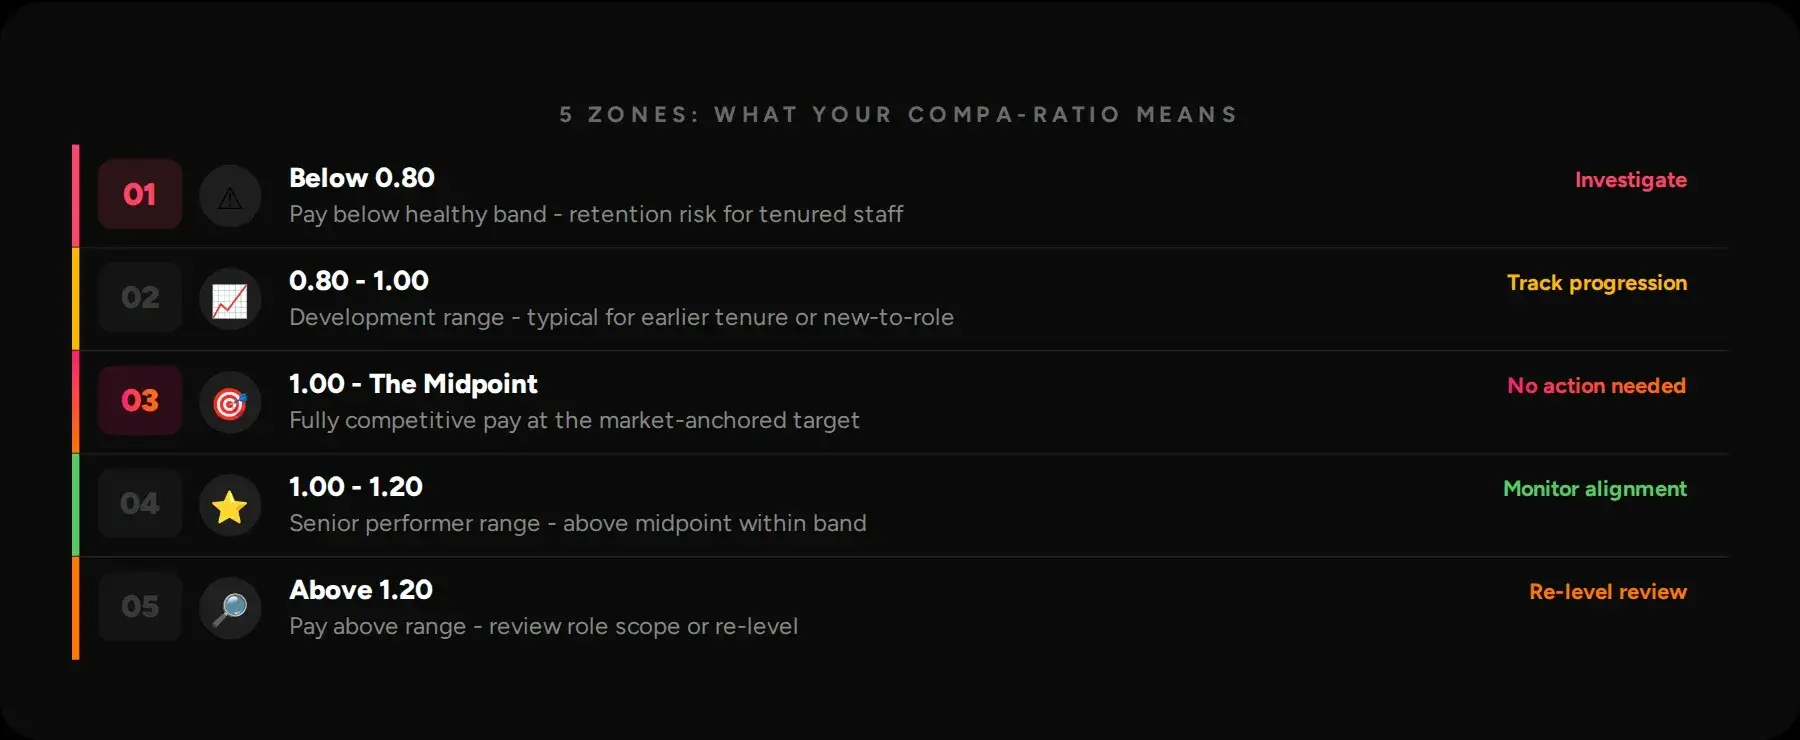
A compa-ratio is only useful once there's a shared definition of what "normal" looks like and what should trigger a closer look. The widely cited working band runs from 0.80 to 1.20 (source needed).
Employees below 0.80 may be at a retention risk - particularly if they're fully proficient and their below-midpoint position isn't explained by tenure or development stage. That said, someone new to a role often belongs at 0.84 or 0.88 while they're still building full proficiency; treating that as an emergency misreads the signal entirely.
Between 0.80 and 1.00 is where most employees in normal development sit. The expectation is that progression toward midpoint happens as tenure and performance build. Between 1.00 and 1.20 is the normal range for a seasoned, high-performing employee in a role they've fully mastered. Above 1.20, the more useful question usually isn't whether to give a raise - it's whether the role itself, or the salary range, needs revisiting.
Treating every below-midpoint employee the same - without accounting for where they actually are in their development - is one of the most common misuses of the metric. The number points to the conversation; it doesn't replace it.
Compa-ratio vs range penetration
Compa-ratio and range penetration answer adjacent but different questions, and mixing them up produces genuinely wrong conclusions.
Compa-ratio measures salary against the midpoint. Range penetration measures how far salary has moved from the range minimum to the range maximum - expressed as a percentage of the full range width. The formula: salary minus range minimum, divided by range maximum minus range minimum.
The practical difference: two employees can have the same compa-ratio but very different range penetration, if their ranges have different widths. Range penetration answers "how far through this band's career progression are they?" - useful for succession planning and development conversations. Compa-ratio answers "how does their pay compare to the market-anchored target?" - the more direct lens for competitiveness and equity.
Most mature compensation functions track both, but compa-ratio is the one built into merit-cycle guidance far more often. It's the simpler number, and it connects more directly to the question managers most commonly need answered.
A compa-ratio flag should trigger a conversation and an investigation - not an automatic action. The number tells you where someone sits. Everything else determines what, if anything, to do about it.

Two limits worth stating plainly
Being precise about what compa-ratio doesn't measure prevents it from being misapplied. Two limitations matter most.
First, it's calculated on base salary only. For roles where variable pay - bonus, commission, equity - makes up a substantial portion of total compensation, base-only compa-ratio can seriously distort the picture. A sales representative with a compa-ratio of 0.88 may be well above market on total cash once OTE is factored in. Assessing total compensation competitiveness requires separate benchmarking against market data for each pay element; compa-ratio alone won't capture it.
Second, compa-ratio says nothing about why a gap exists. A ratio of 0.75 tells you where someone sits relative to the midpoint. It doesn't tell you whether that's because they're new to the role, because the range itself is stale and the midpoint is no longer representative, or because of an inequity that needs correcting. The number is a flag for investigation, not a diagnosis. Using it as one - acting automatically on the ratio without examining the context - is where compa-ratio causes more problems than it solves.
Using it in the merit cycle
Reporting compa-ratio after the merit cycle closes is the least useful thing you can do with it. The organizations that get real value from the metric are the ones that build it into the cycle itself - as a live input into how increases actually get allocated, not a check on what already happened.
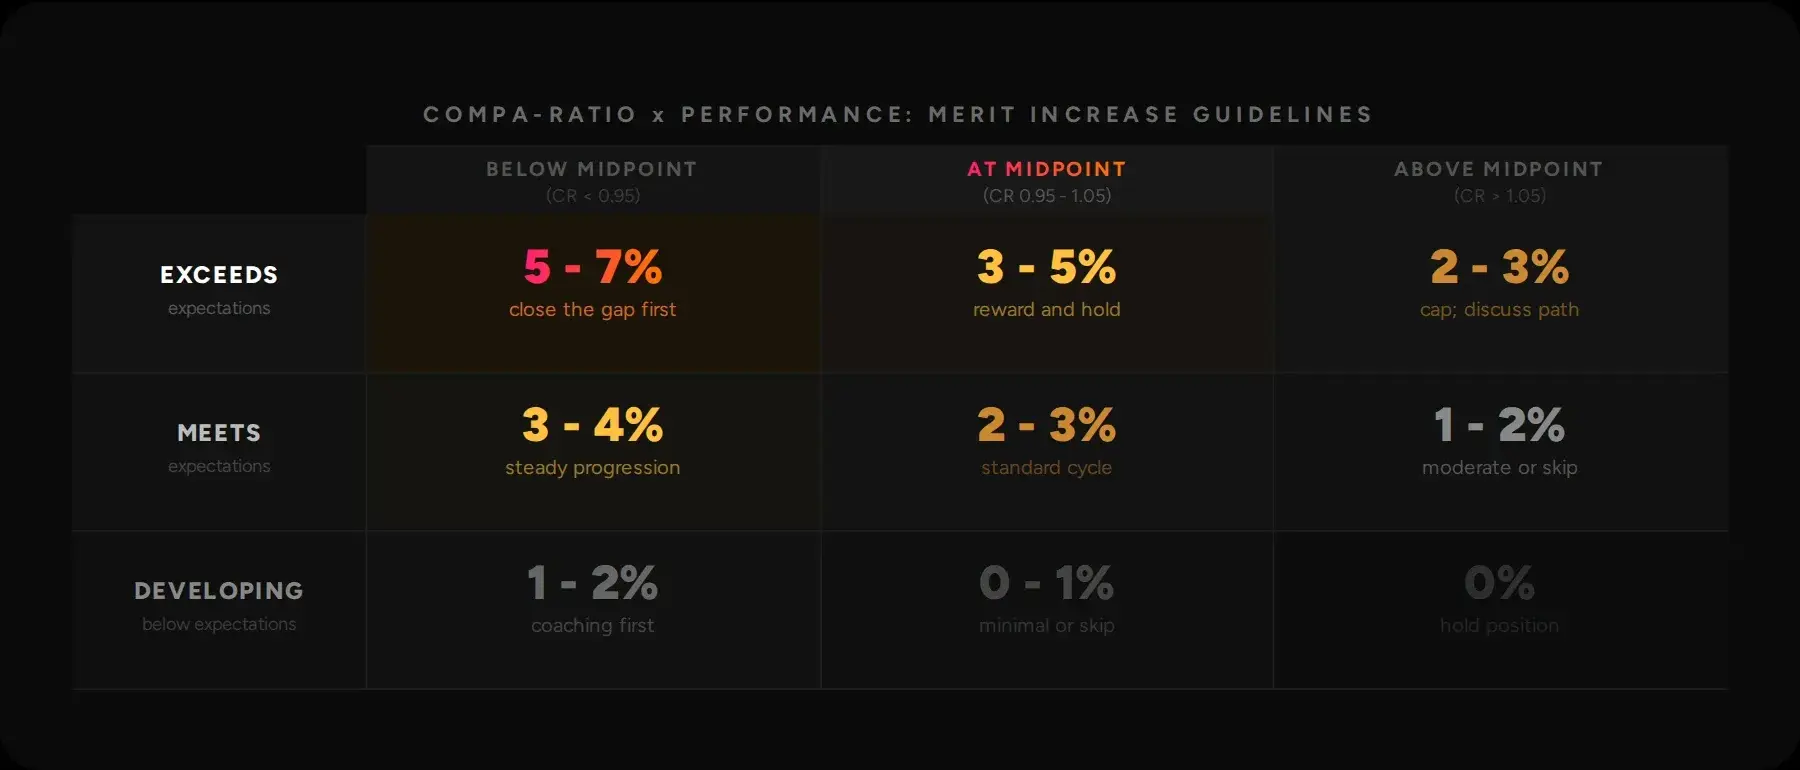
The most common application is a merit matrix that combines position in range alongside performance ratings when setting increase guidelines. Two employees with identical "exceeds expectations" ratings shouldn't automatically receive the same increase percentage if one sits at compa-ratio 0.85 and the other at 1.15. The first employee is further from market; the second is already above it. Giving them equal increases makes the gap wider, not smaller.
The matrix approach gives managers real judgment while embedding guardrails. They still decide on individual increases based on their knowledge of the employee. What changes is that the structure of the guidelines accounts for both where the employee sits in their range and how they've performed - simultaneously, rather than as separate conversations.
The failure mode this prevents is well documented: without a structure connecting compa-ratio to increase guidelines, raises tend to cluster around the same percentage regardless of position in range (source needed). People starting below midpoint drift further below. People near the top get compressed. Both outcomes are the opposite of what a merit cycle is supposed to achieve.
AI insight: what a compa-ratio-integrated merit cycle actually looks like. The traditional merit process runs in a spreadsheet. HR sets a budget percentage, managers fill in increases by feel, and compa-ratio impact is calculated once everything is submitted - to check the damage, essentially. By then, the decisions are made.
AI-powered compensation tools change the sequence. A platform like Tallect can model the compa-ratio impact of proposed increases across the full employee population before the cycle closes - flagging where a proposed raise would create compression between a new hire and a five-year employee in the same band, or where identical increases for a 0.85 and a 1.15 employee would compound existing imbalances.
Managers see the downstream effects of their decisions in real time, while there's still room to adjust. Compa-ratio becomes an input to the merit cycle - not a report generated after it closes.
Beyond individual snapshots
Individual compa-ratio compares one employee to their range midpoint. Aggregate analysis looks at the full distribution across a team, department, or job family - and surfaces patterns that individual calculations miss entirely: systematic underpayment in specific functions, compa-ratio drift across successive cycles as midpoints move but increases don't keep pace, or demographic gaps that may signal a pay equity issue worth deeper investigation.
Compa-ratios analyzed across tenure, gender, and ethnicity give HR teams an ongoing equity monitoring signal between formal audit cycles. If one demographic consistently clusters below 0.90 while another clusters above 1.05, that's not automatically a finding - context always matters - but it's a prompt that shouldn't wait for the next annual review to surface.
Most mature compensation functions run both individual and aggregate analysis routinely. The individual view is useful for merit decisions; the aggregate view is what builds organizational confidence that the pay structure is actually working as intended.
AI insight: automated pay equity monitoring - from annual audit to continuous signal. Manual pay equity analysis using compa-ratio requires dedicated analyst time, typically runs once a year, and surfaces problems that may have formed months earlier. By the time a demographic gap is identified, addressed, and corrected, another cycle has passed.
AI compensation tools can run this analysis continuously. Tallect monitors compa-ratio distributions across the employee population in real time and flags demographic gaps when they cross defined thresholds - not as an automatic verdict, but as a prompt for HR review. The investigation still requires human judgment. What changes is the lag: an issue that would surface after year-end review instead surfaces the week it forms.
Four mistakes to avoid
Compa-ratio is durable because it's simple. But simple metrics attract a specific category of misuse.
Treating all below-midpoint employees identically is the most common one. A new hire at 0.84 is exactly where they should be while building proficiency. A 10-year veteran at 0.84 is a retention flag. The number is the same; the situation is completely different. Acting on ratio alone, without context, produces corrections where none were needed and misses the ones that matter.
Ignoring variable pay for incentive-heavy roles leads to the opposite error - overstating a concern that doesn't exist. A sales employee at 0.88 base compa-ratio may be above market on total cash once OTE is included. Base-only analysis, without a view into variable pay competitiveness, can drive unnecessary off-cycle corrections for roles where base was never the primary compensation lever.
Letting salary ranges go stale quietly breaks the metric from underneath. Compa-ratio is only as meaningful as the range midpoint it's measured against. Ranges that haven't been refreshed against current market data turn the metric into a comparison against an outdated benchmark.
Treating the ratio as a verdict rather than a starting point. The number tells you where someone sits. Everything else - performance, tenure, scope, budget, market context - determines what, if anything, to do about it. A compa-ratio flag should open a conversation, not close one.
Key takeaways
- Compa-ratio = base salary divided by range midpoint. A result of 1.0 means exactly at market target - the organization's benchmark for fully competitive, fully proficient pay.
- The healthy working band runs from 0.80 to 1.20, but context - tenure, development stage, role - determines whether any reading within that band should trigger action.
- Below 0.80 for a proficient, tenured employee is a retention flag worth investigating. For someone new to a role, it's expected and appropriate.
- Compa-ratio and range penetration are related but answer different questions. Use compa-ratio for market competitiveness; range penetration for career progression within a band.
- Base salary only. Variable pay, equity, and other elements need separate benchmarking - base compa-ratio alone will misrepresent competitiveness for incentive-heavy roles.
- The highest-value use is as a live input into the merit matrix - alongside performance ratings - before increases are finalized, not a report run after the cycle closes.
- AI tools enable continuous compa-ratio monitoring and real-time equity analysis across the full employee population, replacing the annual snapshot with an ongoing signal.
Frequently asked questions
How exactly is compa-ratio calculated?
The formula is: compa-ratio = employee's base salary divided by the midpoint of their assigned salary range. If someone earns $85,000 and their range midpoint is $100,000, their compa-ratio is 0.85, or 85%.
The midpoint is the anchor. It represents what the organization has determined is fully competitive, fully proficient pay for that role in that market - typically set through salary survey benchmarking. The quality of the midpoint determines the quality of the metric: a stale or poorly anchored midpoint produces a ratio that looks precise but measures against an outdated target.
What's considered a "good" compa-ratio?
The widely cited healthy band runs from 0.80 to 1.20 (source needed). But whether a specific ratio within that range is "good" depends heavily on context - the employee's tenure in the role, their performance level, and the organization's compensation philosophy.
A ratio of 0.85 is appropriate for someone hired six months ago who is still building full proficiency. The same ratio for a 10-year veteran is a retention flag. 1.0 means exactly at market target. Above 1.20 usually prompts a question about whether the role, not just the pay, needs re-examining.
What's the difference between compa-ratio and range penetration?
They answer adjacent but different questions. Compa-ratio measures how an employee's pay compares to the range midpoint - the market-anchored target. Range penetration measures how far their pay has moved from the range minimum to the maximum, expressed as a percentage of the full range width.
Two employees can have identical compa-ratios but very different range penetration, if their salary bands have different widths. Compa-ratio is the right tool for assessing market competitiveness and equity; range penetration is more useful for succession planning and development progression conversations. Mature compensation functions track both.
Can compa-ratio be applied to total compensation, not just base salary?
In theory, yes - but in practice it requires separate benchmarking data for each pay element. The standard compa-ratio formula uses base salary because base salary benchmarks are the most widely available and consistently defined component. Variable pay - bonus, commission, equity - varies significantly in structure and timing, making a single "total compa-ratio" harder to calculate reliably.
For roles where variable pay is a substantial share of total compensation (sales, trading, senior leadership), base-only compa-ratio can seriously misrepresent competitiveness in either direction. The better approach is to benchmark total cash and total direct compensation separately alongside base, rather than collapsing everything into one ratio.
How often should compa-ratios be calculated and reviewed?
At minimum, at each merit cycle - so that the matrix connecting performance to increase guidelines reflects current position-in-range data. Many organizations also run a mid-year check, particularly for fast-growing teams where new hires and promotions can shift the distribution significantly between annual cycles.
The limiting factor in traditional practice has been range midpoint freshness - if midpoints are only updated annually, running compa-ratios more often than that produces a more frequent snapshot against the same aging benchmark. AI-driven benchmarking tools that continuously update midpoints against live market data remove this constraint, making real-time compa-ratio monitoring practical rather than aspirational.