
How to calculate sales commission, with worked examples
A step-by-step guide to the sales commission formula, from flat rates to tiers, accelerators, split credits, draws and clawbacks.
What commission is calculated on
Before you work out how to calculate sales commission, agree on what the commission is calculated on. Most payout disputes start here, not in the arithmetic.
Every commission plan needs three inputs to be defined in writing:
- Commission base. The number the rate applies to. It might be booked revenue, gross margin, or payments actually collected from the customer.
- Plan period. Monthly, quarterly, or annual. The period decides when sales count, when tiers reset, and when payouts are due.
- Quota. The sales target for the period. Many plans use quota to set tiers and accelerators, so it affects the rate as well as the result.
Two teams can use the same 5% rate and pay very different amounts. One pays on bookings the day a contract is signed. The other pays on margin once the invoice is collected. Neither is wrong, but each rep needs to know which one applies to them.
All figures in this article are illustrative. They show how the maths works and are not benchmarks, typical rates, or industry averages.
The basic sales commission formula
Learning how to calculate sales commission starts with the simplest sales commission formula:
Commission = Commission base × Commission rate
Worked example: flat rate
Illustrative figures. A rep on a flat 5% plan closes ₹8,00,000 of sales in a month.
Commission = ₹8,00,000 × 5% = ₹40,000
If the base is gross margin instead of revenue, the same formula applies to the margin figure. Suppose that ₹8,00,000 of sales carries ₹3,00,000 of gross margin and the plan pays 12% of margin. The commission is ₹3,00,000 × 12% = ₹36,000.
Worked example: commission against a target incentive
Many plans start from a target incentive, which is what a rep earns for hitting 100% of quota. The formula becomes:
Commission = Target incentive × Quota attainment
Illustrative figures. A rep has a quarterly quota of ₹25,00,000 and a target incentive of ₹1,00,000. They close ₹20,00,000, which is 80% attainment.
Commission = ₹1,00,000 × 80% = ₹80,000
Dividing the target incentive by the quota gives the effective rate: ₹1,00,000 ÷ ₹25,00,000 = 4%. Checking this number is a quick way to compare plans that are written differently.
Tiered commission calculation
A tiered plan pays different rates on different slabs of sales. Tiers are where manual calculation first gets tricky, because there are two common ways to apply them, and they give different answers.
- Marginal tiers. Each slab earns its own rate, like income tax slabs. Sales above a threshold earn the higher rate, and earlier sales keep the lower one.
- Retroactive tiers. Once a rep crosses a threshold, the higher rate applies to all sales in the period, back to the first rupee.
Worked example: marginal vs retroactive
Illustrative figures. A rep has a quarterly quota of ₹10,00,000. The plan pays 4% on the first ₹6,00,000 and 6% from ₹6,00,000 up to quota. The rep closes ₹9,00,000.
Slab | Sales in slab | Rate | Commission |
|---|---|---|---|
₹0 to ₹6,00,000 | ₹6,00,000 | 4% | ₹24,000 |
₹6,00,000 to ₹10,00,000 | ₹3,00,000 | 6% | ₹18,000 |
Total | ₹9,00,000 | ₹42,000 |
Caption: Illustrative marginal tier calculation for a rep at ₹9,00,000 of sales.
Under marginal tiers, the rep earns ₹42,000.
Under retroactive tiers, all ₹9,00,000 earns 6%: ₹9,00,000 × 6% = ₹54,000.
Same rep, same sales, same rates, and a ₹12,000 difference. If the plan document does not say which method applies, expect a dispute.
Watch the cliff in retroactive tiers
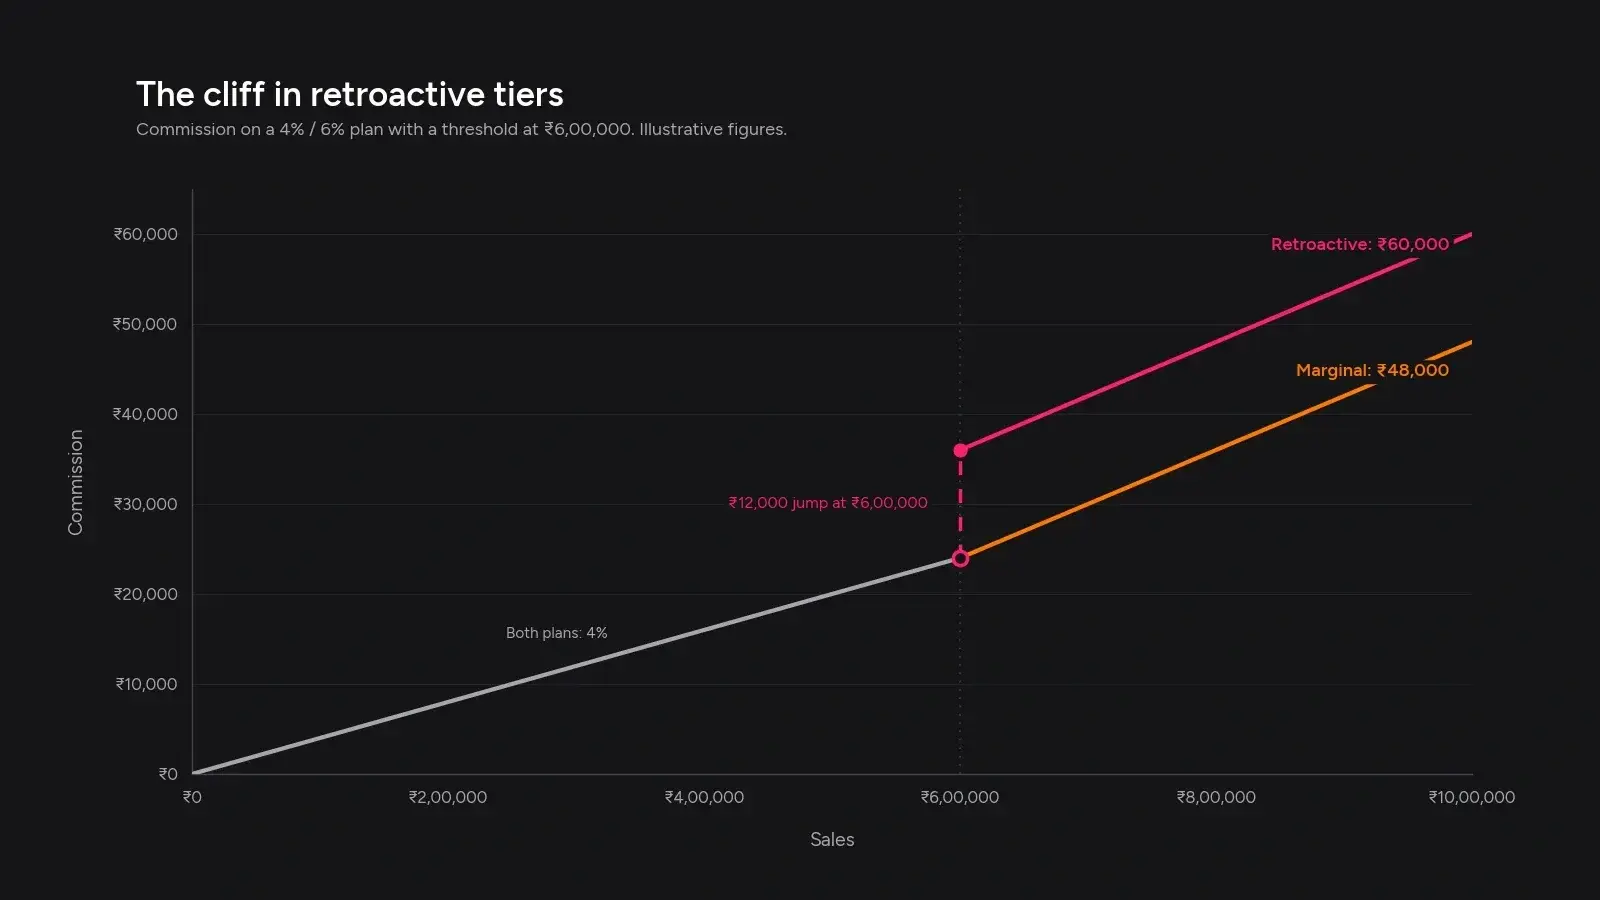
Retroactive tiers create a sharp jump at each threshold. Using the same plan, a rep at ₹5,90,000 earns ₹5,90,000 × 4% = ₹23,600. A rep at ₹6,10,000 earns ₹6,10,000 × 6% = ₹36,600. An extra ₹20,000 of sales adds ₹13,000 of commission. That jump gives reps a strong reason to pull deals into or push them out of a period, so finance teams should look closely at deals timed around thresholds.
Plotting commission against sales for both methods makes the jump easy to see. The marginal line rises smoothly, while the retroactive line steps up sharply at ₹6,00,000.
Accelerators above quota
An accelerator is a higher rate that applies to sales beyond 100% of quota. It rewards over-performance, and it is usually applied on a marginal basis, to the sales above quota only.
Worked example: rep at 125% of quota
Illustrative figures. Using the same plan, add an accelerator of 9% on sales above the ₹10,00,000 quota. The rep closes ₹12,50,000, which is 125% attainment.
- First slab: ₹6,00,000 × 4% = ₹24,000
- Second slab: ₹4,00,000 × 6% = ₹24,000
- Above quota: ₹2,50,000 × 9% = ₹22,500
Total commission = ₹24,000 + ₹24,000 + ₹22,500 = ₹70,500
The effective rate is ₹70,500 ÷ ₹12,50,000 = 5.64%, higher than any rate below quota. That is the point of an accelerator.
Some plans express the accelerator as a multiplier instead, such as 1.5 times the top base rate. In this example, 1.5 × 6% gives the same 9%. Write down which form your plan uses, so whoever calculates payouts applies it the same way every period.
Caps and decelerators
Some plans limit the upside. A cap stops commission growing beyond a set attainment or amount. A decelerator cuts the rate above a level, often to protect against windfall deals the rep did little to win. Both change the payout for top performers, so test them against your largest expected deals before the period starts.
Split credits between reps
Many deals involve more than one person: an account executive, a solutions specialist, a partner manager, or a regional overlay. A split credit plan decides how much of each deal counts toward each person's numbers.
- Percentage split. The deal value is divided, for example 70% to the account executive and 30% to the overlay. Total credit equals the deal value.
- Double credit. Each person gets full credit for the deal. Total credit is more than the deal value, so the cost of the plan rises.

Worked example: a 70/30 split
Illustrative figures. A ₹6,00,000 deal is split 70% to the account executive and 30% to an overlay specialist.
- Account executive credit: ₹6,00,000 × 70% = ₹4,20,000
- Overlay credit: ₹6,00,000 × 30% = ₹1,80,000
Now apply each person's plan. The account executive is on the tiered plan above, and had ₹4,00,000 of sales before this deal.
- Before the deal: ₹4,00,000 × 4% = ₹16,000
- After the deal, at ₹8,20,000: (₹6,00,000 × 4%) + (₹2,20,000 × 6%) = ₹24,000 + ₹13,200 = ₹37,200
- Commission from this deal: ₹37,200 − ₹16,000 = ₹21,200
The split pushed the account executive past the ₹6,00,000 threshold, so part of their share earns the higher rate. The same deal can be worth different amounts to different reps, depending on where each one sits in their tiers.
Suppose the overlay is on a flat 3% plan. With a 30% split, they earn ₹1,80,000 × 3% = ₹5,400. With double credit, they earn ₹6,00,000 × 3% = ₹18,000. Agree the split rules before the deal closes, not after.
Draws and clawbacks
Draws and clawbacks deal with timing: paying reps before commission is earned, and taking back commission when a deal falls through.
Recoverable and non-recoverable draws
A draw is an advance against future commission, often used for new hires or long sales cycles.
- A recoverable draw is paid back from later commission.
- A non-recoverable draw is a guaranteed minimum. If commission falls short, the company absorbs the difference.
Worked example: a recoverable draw
Illustrative figures. A rep has a recoverable draw of ₹30,000 a month.
- Month 1: the rep earns ₹18,000 of commission. They are paid the ₹30,000 draw. The ₹12,000 difference is carried forward as a balance to recover.
- Month 2: the rep earns ₹50,000. The ₹12,000 balance is deducted, leaving ₹38,000. That is above the ₹30,000 draw, so the rep is paid ₹38,000 and the balance is cleared.
Under a non-recoverable draw, the rep would be paid ₹30,000 in month 1 and the full ₹50,000 in month 2. The ₹12,000 shortfall is never recovered.
Worked example: a clawback
A clawback recovers commission already paid when a customer cancels, does not pay, or is refunded within a set window.
Illustrative figures. A rep is paid 5% on a ₹5,00,000 deal, which is ₹25,000 in the first quarter. In the second quarter, the customer cancels.
- Full clawback: the plan recovers the whole ₹25,000, usually by deducting it from the rep's next commission payment.
- Partial clawback: if ₹2,00,000 was collected before the cancellation and the plan only claws back the uncollected portion, the recovery is ₹3,00,000 × 5% = ₹15,000.
Whether and how a draw balance or clawback can be recovered from pay depends on local employment law and the terms of the plan. Check with legal counsel before writing recovery terms into a plan.
Now do this for 500 reps

Every calculation above is manageable by hand for a handful of reps. Now picture 500 reps across several plans, each with its own tiers, accelerators, splits, draws, and clawback windows. Add quota changes, territory moves, and new joiners partway through the quarter, and each one means recalculating payouts that were already worked out. At that scale, manual calculation becomes slow and error-prone, and every mistake shows up in someone's pay. Automating the calculations removes that manual work, and Tallect's Sales Incentive module is built to help teams do exactly that.