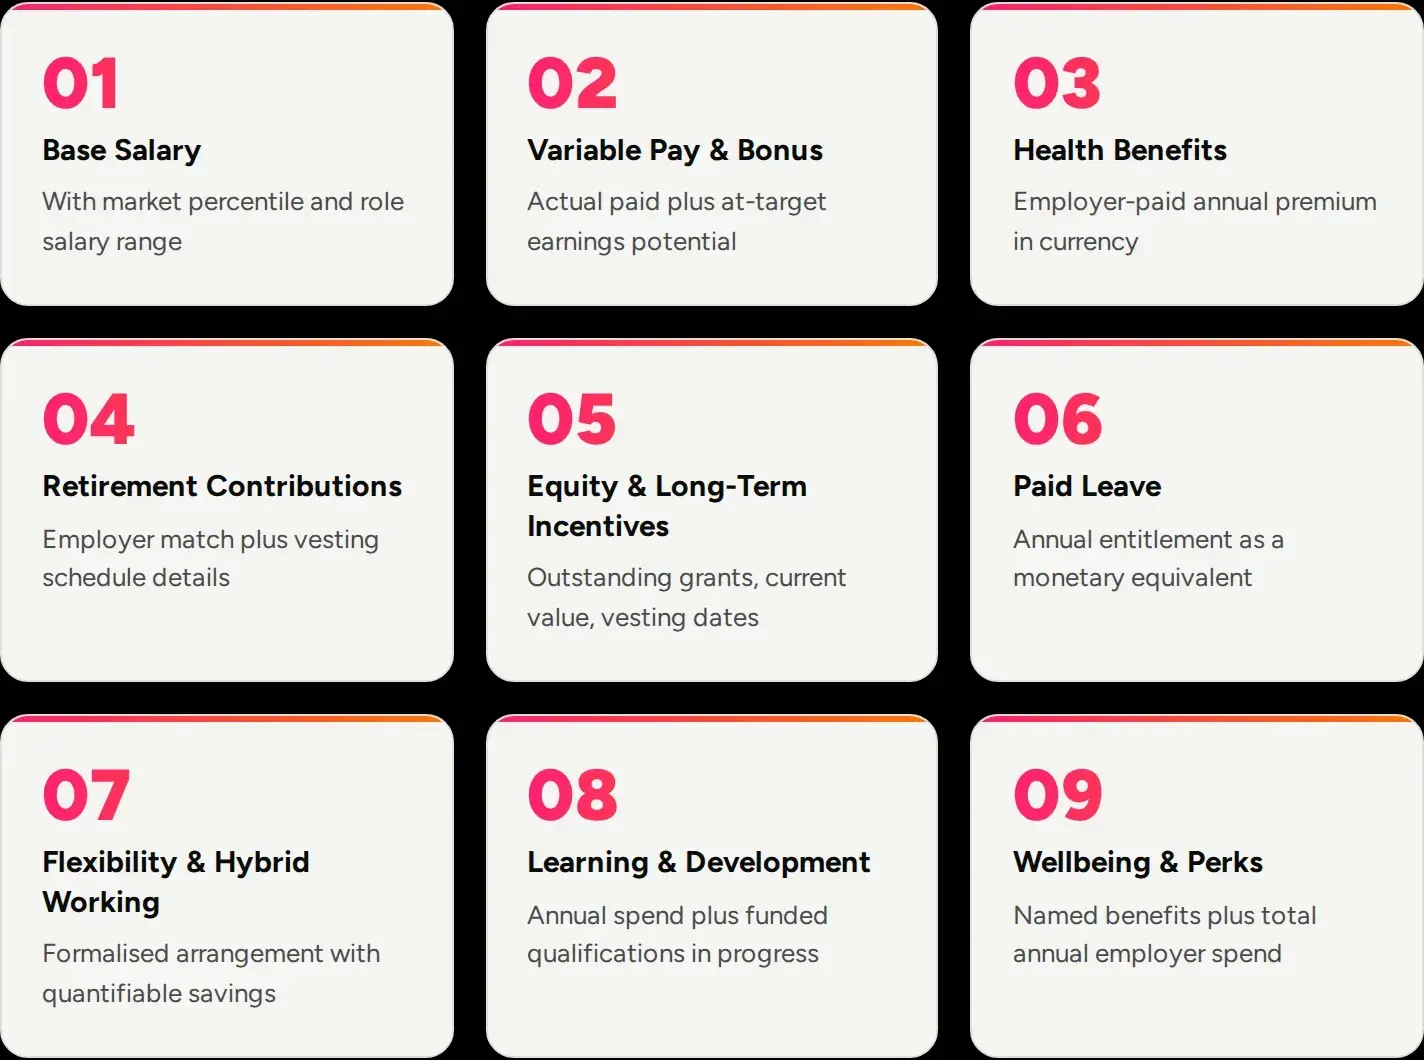
Nine components worth including in every total rewards statement
Most statements show the salary. Very few show everything the organisation actually spends on an employee.
Most statements show the salary. Very few show everything the organisation is actually spending on an employee. That gap is exactly where retention conversations tend to go wrong.
A total rewards statement is one of the most underused communication tools in HR. Done well, it closes the gap between what an organisation actually spends on an employee and what that employee believes they are worth to the company. Done poorly, which usually means showing only base salary and a brief benefits summary, it leaves the most persuasive numbers entirely off the page.
The case for building a more complete statement is not abstract. Employees tend to underestimate the value of their benefits by a wide margin, particularly health coverage and retirement contributions (source needed). When someone considers a move to a competitor, they are typically comparing salary to salary rather than total package to total package, because their current employer never made the full picture visible.
What follows is a practical breakdown of the nine components worth including, in the order they tend to carry the most persuasive weight with employees.
The nine components at a glance
- Base salary: with market percentile and role salary range.
- Variable pay and bonus: actual paid plus at-target earnings potential.
- Health benefits: employer-paid annual premium in currency.
- Retirement contributions: employer match plus vesting schedule details.
- Equity and long-term incentives: outstanding grants, current value, vesting dates.
- Paid leave: annual entitlement as a monetary equivalent.
- Flexibility and hybrid working: formalised arrangement with quantifiable savings.
- Learning and development: annual spend plus funded qualifications in progress.
- Wellbeing and perks: named benefits plus total annual employer spend.
1. Base salary, with context
Base salary always leads, but the context around it matters more than most statements reflect. Rather than printing the annual figure alone, show where it sits relative to the salary range for the role. If the organisation's compensation philosophy targets a specific market percentile, include that too.
An employee seeing £62,000 learns their pay. An employee seeing £62,000 positioned at the 65th percentile for this role in this region, within a range of £55,000 to £70,000, understands their pay. That second version also communicates that the organisation has a structure, a methodology and a rationale behind compensation decisions. It tells a different story than a number someone negotiated on a particular Tuesday.
2. Variable pay and bonus
Variable pay belongs on the statement in two forms: what was actually paid in the most recent cycle, and what the target payout looks like for the role at standard performance. The second number is often more persuasive than the first, because it anchors the employee's understanding of their earning potential rather than just their trailing history.
For roles with commission structures, on-target earnings should appear alongside the base figure from the start. Showing base salary alone systematically understates the value of incentive-heavy positions. Employees in those roles often anchor to the base number in ways that quietly damage retention over time.
3. Health benefits at employer cost
This is the component where the gap between perceived and actual value is widest. Employees know they have health coverage. Most have no idea what the employer is paying for that coverage on their behalf.
Express the employer-paid premium as an annual figure. For a family health plan, that number can be substantial in many markets, and most employees have never seen it made explicit (source needed). What matters is that the employer contribution is visible in currency, not described as "comprehensive health coverage" in the abstract.
How AI pulls the true cost of benefits
Pulling the employer cost of health, dental and vision coverage from carrier invoices has traditionally been a manual reconciliation exercise run once a year, if at all. AI-powered platforms like Tallect connect directly to benefits administration systems and carrier data feeds to derive per-employee benefit costs continuously, updated each quarter rather than once at year end.
For organisations with tiered benefit plans where coverage differs by level, role or family status, the AI applies the correct rate per employee automatically. An employee on a family health plan and one on single coverage each see their actual employer contribution, not a blended average that misrepresents both.
4. Retirement contributions
Employer pension or 401(k) contributions are routinely undervalued because they are invisible until retirement approaches. Show the annual employer contribution in pounds or dollars rather than as a percentage alone, and include a note on the vesting schedule if one applies.
Vesting schedules deserve particular attention. An employee who is two years from full vesting on a meaningful employer match is holding deferred compensation they may not fully recognise. Making that explicit creates a concrete financial reason to stay that pure salary comparisons cannot replicate. "Your unvested employer contributions as of today total £6,800, with full vesting in 24 months" is a sentence that changes the conversation.
5. Equity and long-term incentives
For organisations that grant equity, whether stock options, RSUs, ESOPs or other long-term incentive structures, the total rewards statement should show outstanding grants, current approximate value where calculable, and the vesting schedule in plain language.
Equity communication is an area where most organisations underperform relative to its actual retention power. A grant of 2,000 RSUs vesting over four years carries genuine financial weight. But if an employee has to locate their original offer letter to find it, that equity is doing almost nothing for their sense of what leaving would actually cost them. Surfacing this number annually is the fix.

6. Paid leave as a monetary value
Paid leave is standard enough that most employees do not think of it as compensation until they consider what it would cost to replace it at a company with a less generous policy. Expressing annual leave as a monetary equivalent, calculated as daily rate multiplied by leave days, makes its value tangible in a way that "25 days annual leave" does not.
The same logic applies to other paid time off: sick leave policies, parental leave provisions, sabbaticals for longer-tenured staff. These provisions carry real financial value that translates poorly into the casual comparison an employee might make during a LinkedIn conversation with a recruiter.
7. Flexibility and hybrid working
The value of remote or hybrid working arrangements is increasingly quantifiable. Employees calculate commuting cost savings, childcare flexibility and the time value of reclaimed hours spent on public transport. For city-based employees, the annual commute saving can run to several thousand pounds (source needed).
Even without a precise monetary translation, naming the arrangement explicitly, such as "three days remote per week, as agreed," formalises a benefit that might otherwise feel informal and precarious. An employee who sees their flexibility arrangement on their total rewards statement understands the organisation views it as part of the package, not an accommodation that could be reversed without notice.
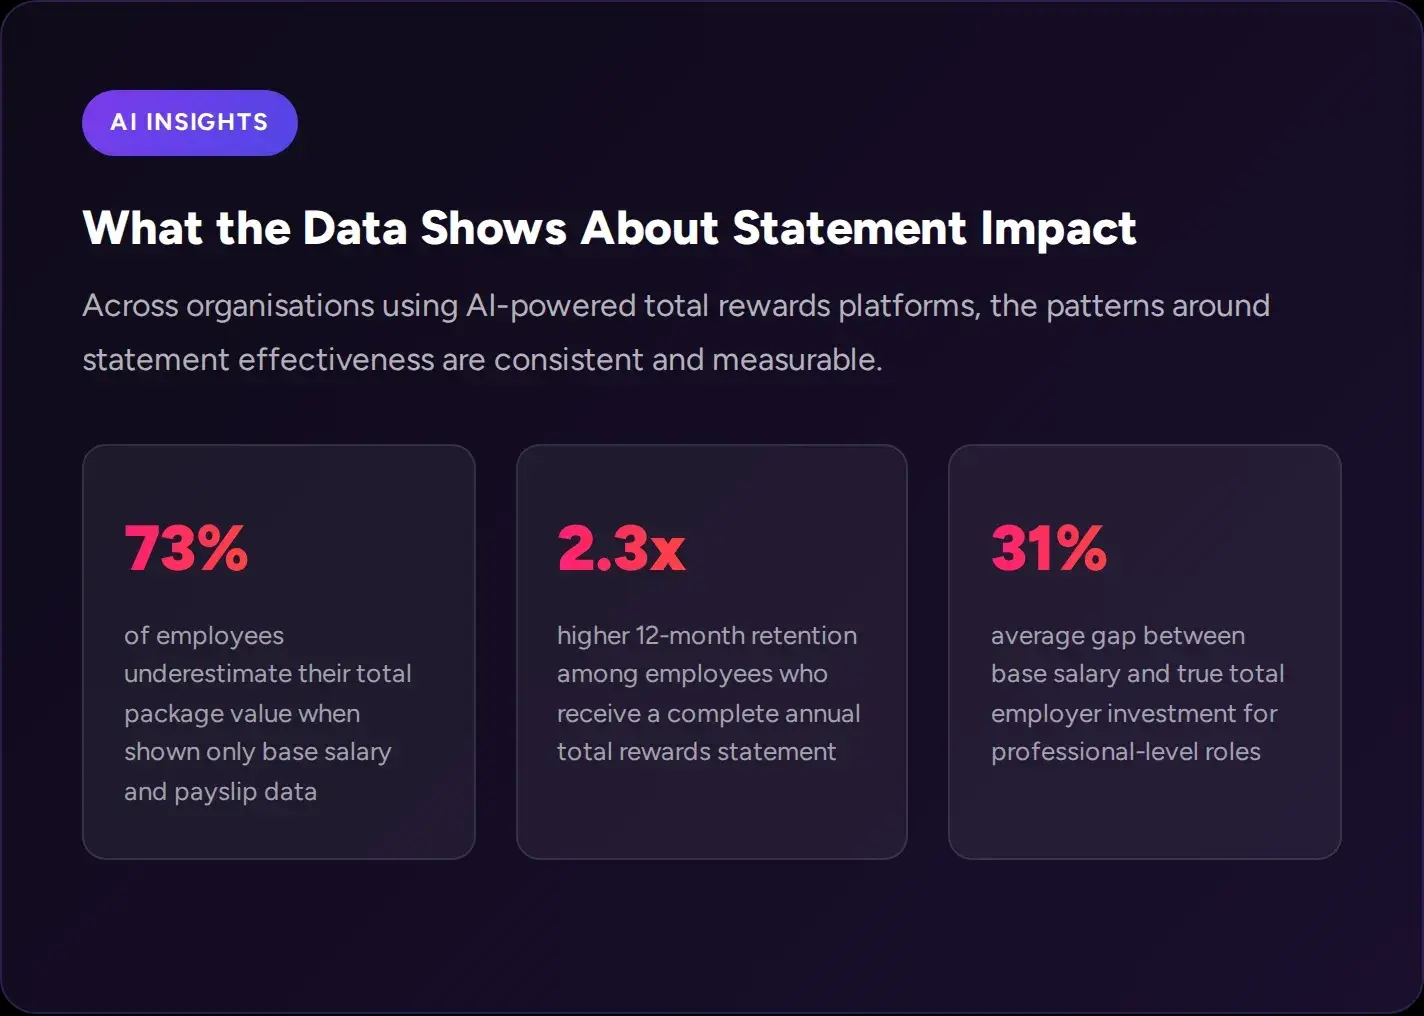
The most striking pattern from organisations that have adopted comprehensive total rewards statements is how quickly employee perception shifts. When the full package is presented as a single annual "total employer investment" figure, employees consistently rate their satisfaction with compensation higher than peers who see only payslip data (source needed). That shift happens without any change to the actual package. The number was always there; the statement made it visible.
AI platforms also surface something manual statements cannot: the moment an employee becomes a flight risk based on compensation gap signals. When HRIS data shows an employee approaching a vesting cliff and market data shows their skills commanding a premium elsewhere, an automated statement with a targeted equity reminder can appear at exactly the right time, without anyone in HR manually tracking the calendar.
8. Learning and development
Annual learning budgets, funded professional qualifications, paid conference attendance and professional body memberships belong on the total rewards statement as annual spend. Many organisations invest meaningfully per employee in this category, yet almost none communicate that figure to the employee it is being spent on (source needed).
Include funded qualifications in progress by name where relevant. An employee partway through a funded professional qualification has a concrete reason to stay that a salary comparison will never reveal. They need to be reminded of it annually, not once at the start of a programme and never again.
9. Wellbeing and perks in aggregate
EAP programmes, gym subsidies, wellbeing allowances, employee discounts, life assurance, income protection and critical illness cover are real costs that appear on no payslip and in no casual conversation about compensation. Summarised as an annual aggregate, they can add up to a significant figure per employee at organisations that invest meaningfully in this area (source needed).
The instinct is to list them by name. The more persuasive approach is to list them by name and include a total annual employer spend line below the list. The list communicates breadth; the total communicates value. One line changes the entire frame from "your company offers a gym subsidy" to "your employer spent an additional £1,840 on your wellbeing this year."
Personalised statements at scale
Historically, the main obstacle to comprehensive total rewards statements has not been willingness but workload. Pulling figures from payroll, benefits administration, equity management and HRMS into a coherent per-employee view has required weeks of HR and finance time, typically resulting in one static PDF distributed once a year to every employee regardless of their individual package composition.
AI platforms change the economics entirely. Tallect connects to the underlying data sources and compiles each employee's statement dynamically, applying the correct benefit rates, vesting schedules and equity values specific to that individual. A 500-person organisation that previously ran one annual statement cycle can move to quarterly personalised updates without adding any headcount to HR.
What a full package looks like
For a professional-level employee on a base salary of £65,000, here is what the total employer investment might look like when all nine components are expressed in annual currency terms.
Component | Annual value |
|---|---|
Base salary | £65,000 |
Variable pay (at-target, 10%) | £6,500 |
Health and medical (employer premium) | £3,600 |
Employer pension contributions | £3,900 |
Paid leave (monetary equivalent, 25 days) | £2,500 |
Hybrid working (commute savings estimate) | £2,800 |
Learning and development budget | £2,000 |
Wellbeing benefits and perks | £1,400 |
Total employer investment | £87,700 per year |
Caption: Illustrative example only. Actual values vary significantly by organisation, sector, geography and individual benefit elections.
Putting it all together
A well-built total rewards statement presents each of the nine components above as an annual figure, then totals them, showing the employee a "total employer investment" number that typically runs well above base salary for most professional roles (source needed).
That total is the number a recruiter almost never gives a departing employee. It is the figure that, when made visible, most clearly illustrates the real cost of moving, not just to the organisation, but to the employee themselves. The frequency matters too: an annual statement covers the minimum. Some organisations now move to quarterly updates, particularly for equity holders where value is more dynamic.
Component | What to show | Common omission |
|---|---|---|
Base salary | Annual figure plus market percentile and range | Percentile and range context left out |
Variable pay | Actual paid plus at-target earnings figure | At-target figure missing entirely |
Health benefits | Employer-paid annual premium in currency | Described as "comprehensive coverage" only |
Retirement | Annual employer contribution plus vesting timeline | Percentage shown; unvested balance not surfaced |
Equity | Outstanding grants, current value, vesting dates | Not included or buried in original offer letter |
Paid leave | Leave days converted to monetary equivalent | Days only, no monetary context given |
Flexibility | Formalised arrangement plus commute savings estimate | Not mentioned in the statement at all |
L&D | Annual spend plus active funded qualifications | Listed generically or omitted |
Wellbeing | Named benefits plus annual aggregate employer spend | Benefits listed but no cost figures shown |
Caption: Each omission is a missed opportunity to shift how an employee perceives the value of staying.
From annual exercise to always-on communication
The most sophisticated use of AI in total rewards communication is not just automating statement assembly. It is changing when those statements appear. Static annual documents reach employees in January and are largely forgotten by March. AI-powered platforms like Tallect can surface a personalised statement at precisely the moment it matters most: before a performance review, when market data shows a compensation gap widening, or when an employee crosses a tenure milestone that unlocks new benefits.
That shift from annual document to contextual communication is what separates the organisations that use total rewards statements to retain people from the ones that produce them to tick a compliance box. The difference is not the content. It is the timing, the personalisation and the delivery channel, all of which AI manages automatically once the underlying data connections are in place.
Frequently asked questions
How often should total rewards statements be issued?
Annual is the minimum, typically aligned to the start of the performance year or the calendar year. Organisations with significant equity components or dynamic variable pay often move to quarterly updates. The goal is to keep the full picture visible before a resignation conversation rather than surfacing it after one has already started.
Should we include equity even when the value fluctuates frequently?
Yes, and the fluctuation itself is part of the communication. Show the grant size, the vesting schedule and the value as of a specific stated date. Employees understand that equity values move. What hurts retention is having no visibility at all into what they are holding or when it vests.
Should we show the at-target bonus if the employee has never achieved it?
Show both: what was actually paid in the last cycle and what the at-target figure is for the role. Label them clearly so there is no confusion. The at-target number anchors the employee's understanding of earning potential, which is often more relevant to their assessment of the role's value than a single year's actual payout.
How do we calculate a monetary value for hybrid working?
The most defensible approach uses actual commuting cost data: ask employees to self-report their typical commuting spend, or use postcode-to-office-distance estimates with public transport costs, then multiply by the number of days saved per year under the hybrid arrangement. For London-based employees, a realistic mid-range estimate runs to a few thousand pounds a year (source needed). Even a conservative figure makes the benefit tangible in a way that "flexible working" as a text label does not.
What if benefit costs vary significantly across our workforce?
Personalise the statement to reflect individual benefit elections wherever possible. An employee on a family health plan and one on a single plan are receiving very different levels of employer investment. Showing each the correct figure for their actual coverage is more accurate and more persuasive than a blended average that undersells one group and overstates it for another.
How do we handle statements for employees on probation or part-time contracts?
Issue statements at the same cadence, adjusted to reflect the actual package those employees are eligible for. Part-time employees should see their pro-rated figures clearly labelled. Employees still in probation may not yet be eligible for certain benefits, which should be noted along with the date at which eligibility begins. Transparency about what is coming is itself a retention tool.
Will sharing detailed cost information create expectations about future pay?
A well-designed statement includes a note that benefit costs, employer contributions and package composition reflect the current period and may change in line with organisational policies. The statement communicates current investment; it is not a contractual commitment to future levels. Most legal and HR teams are comfortable with a standard disclaimer along those lines, worth having legal counsel review once for your specific jurisdiction.
What format works best for distributing statements?
Digital and personalised tends to outperform printed and generic (source needed). A statement that lives in an employee portal or arrives as a personalised PDF by email is more likely to be read than one distributed as a generic document in a team briefing. For organisations with significant mobile workforces, a mobile-optimised format matters too. The statement an employee can pull up on their phone during a recruiter call is the one that actually does retention work.
How long does it take to build a statement programme from scratch?
Manually, the first cycle typically takes several weeks of HR and finance time, most of which is spent reconciling data across systems. With an AI-powered platform that connects to existing HRMS, payroll and benefits systems, that timeline compresses to days for the initial setup, after which each subsequent cycle is largely automated. The upfront data-mapping investment pays for itself quickly once manual consolidation is gone.
Can total rewards statements help with candidate attraction?
Yes, with different framing for the recruitment context. The total employer investment story works well as a "full package" breakdown in offer letters, framed around what a candidate stands to receive. Candidates who receive a detailed package breakdown alongside a salary figure tend to accept offers more often and arrive with better-matched expectations (source needed).
Does the order of components on the statement matter?
It does. Leading with base salary is non-negotiable as that is the anchor employees expect. After that, the sequence should broadly follow financial weight: variable pay, then health benefits, then retirement contributions, then equity. Wellbeing perks and flexibility, while meaningful, land better at the end once the financial foundations are established. The goal is that each component the employee reads adds to a growing sense of the total picture rather than feeling like an afterthought tacked on at the end.