Real-time data vs quarterly data for pay decisions
Quarterly survey data can leave your salary decisions months behind the market. Here is how to know which data cadence your roles actually need.
Companies that rely only on annual salary surveys are often working with pay data that is many months old by the time they use it, according to a 2026 Mercer analysis (source needed). For most administrative and operations roles, that lag is tolerable. For software engineers, product managers, and go-to-market specialists in active hiring markets, the same lag can leave your offer numbers well below where the market has moved (source needed).
There is no universal answer to how frequently you should refresh your compensation data. The right cadence depends on the role, the talent market, and what you are using the data for. But most organisations get this wrong in the same direction. They apply their slowest data cadence uniformly across all roles, then wonder why their offer acceptance rate is declining in specific role clusters while staying stable in others.
Understanding the genuine difference between real-time and quarterly data, and when each is appropriate, is one of the more practical things a compensation team can get right.
What real-time actually means
The term real-time gets used loosely in HR technology marketing, so it is worth being precise. In the context of pay data, real-time does not mean updated every second. It means data derived from actual job postings, accepted offers, and active hiring decisions within the past 30 to 90 days. The alternative is a survey that collected data six months ago and published it three months after that.
The most common real-time sources are:
- Job posting analytics, which scrape salary ranges from public job ads and aggregate them by role and location.
- Offer acceptance data from ATS platforms, which captures what candidates actually accepted.
- Crowdsourced compensation data from platforms where employees self-report their total compensation packages.
Each of these has limitations. Job posting data captures what companies are advertising, which may not reflect what they are actually paying to close candidates in competitive situations. Crowdsourced data has self-selection bias and inconsistent role definitions. But combined, they give you a picture of where the market is right now, not where it was a year ago.
How quarterly survey data works
Traditional salary surveys collect data from participating organisations once or twice a year. A company submits its salary data for each job family in a standardised format. The survey provider aggregates that data, applies statistical adjustments, and publishes the results several months later.
The output is a percentile table showing what the market pays at P25, P50, P75, and P90 for each job family, typically broken out by industry, geography, and company size. This data is rigorous, statistically reliable, and based on actual payroll data rather than postings or self-reports.
The limitation is age. Say you use Q1 2026 survey data in your October 2026 compensation review. That data was collected in late 2025, so it reflects the market as it existed 12 to 14 months before you act on it.
Factor | Real-time data | Quarterly survey data |
|---|---|---|
Data age at point of use | 30 to 90 days | 12 to 18 months |
Statistical rigour | Moderate (crowdsourced or posting-based) | High (actual payroll submissions) |
Role coverage | Strong for common roles; thinner for specialist or senior roles | Broad, especially for established job families |
Best use case | Offer calibration, mid-cycle checks, hot talent markets | Annual band setting, compensation philosophy anchoring |
Cost | Varies; often subscription or per-query | Annual survey participation fee |
Reliability during market disruption | High; reflects current conditions immediately | Low; survey captures pre-disruption baseline |
Caption: Comparison of data characteristics at the point of use in a typical annual compensation cycle.
The cost of data lag
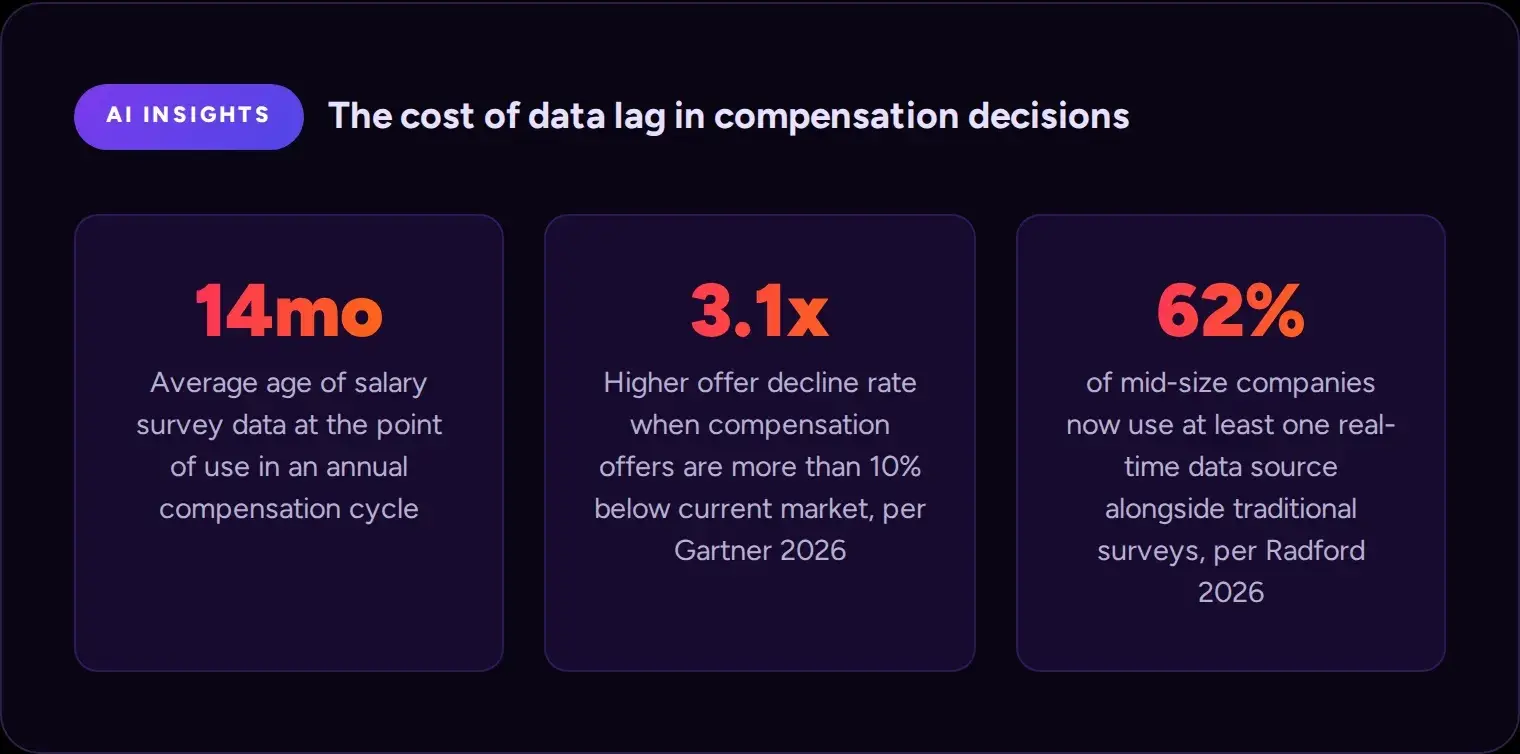
- Salary survey data is often more than a year old at the point of use in an annual compensation cycle (source needed).
- Offer decline rates rise sharply when offers sit more than 10% below the current market, per Gartner 2026 (source needed).
- A growing share of mid-size companies now use at least one real-time data source alongside traditional surveys, per Radford 2026 (source needed).
When quarterly data is fine
Not every role needs real-time pay data. Annual or quarterly survey data is perfectly adequate when three things are true: the market rate is relatively stable year over year, you have low turnover and a manageable hiring volume, and the talent market is not especially competitive.
This typically includes administrative support roles, finance operations, most HR generalist positions, and many middle-management roles in sectors that are not experiencing rapid growth or contraction. In these categories, the market does not move fast enough to make a 12-month data lag operationally dangerous. Your bands may drift slightly, but not enough to cause systematic offer failure or retention problems.
The other situation where quarterly data works well is when you are setting your annual compensation bands and need a statistically reliable anchor point. Real-time data is valuable for checking current direction. But it is not always robust enough to be the sole basis for a major band revision that will govern all your salary decisions for the next twelve months.
Automatic flagging when survey data goes stale
Tallect cross-references your published pay bands against live market signals on a rolling basis. When the real-time data for a specific role cluster diverges from your survey anchor by more than a configurable threshold, the platform flags it automatically. You decide what to do with that signal. The platform makes sure you see it before it becomes a candidate experience problem.
When you need real-time signals
There are three situations where relying on quarterly survey data alone is a genuine operational risk.
The first is any period of rapid market disruption. The AI engineering talent market in 2024 and 2025 moved faster than any annual survey could capture. Companies that benchmarked their Q1 2025 offer cycles against 2023 survey data were, in some role clusters, offering well below where the market had actually landed (source needed). Annual surveys simply cannot capture that velocity.
The second is when you are actively hiring in volume. If you are making thirty engineering offers a month, your acceptance rate data from your own ATS is a real-time market signal in itself. A decline rate that moves from 15% to 35% over six weeks tells you something has shifted. Combining that internal signal with external real-time data helps you understand whether the shift is structural or a temporary spike.
The third is for senior and specialist roles where the talent pool is small and individual negotiating dynamics matter. For a CFO or a Chief Data Officer search, the survey P75 is a starting point, not a landing number. What comparable executives are actually accepting, from companies you can identify specifically, is the real data you need.
Quarterly survey data tells you where the market was. Real-time data tells you where it is. For most stable roles, the difference is small. For hot skills categories, it can be the difference between winning a candidate and losing them at offer stage.
Blended data view for every role cluster
Tallect presents survey anchor data and real-time market movement on a single dashboard, per role family. Take your software engineering cluster. You can see what the latest published survey says at P75, what the real-time posting and offer data shows for the same role in your target geographies, and where the two figures diverge. That divergence is the number you actually need to make a sound offer decision today.
The two-layer model
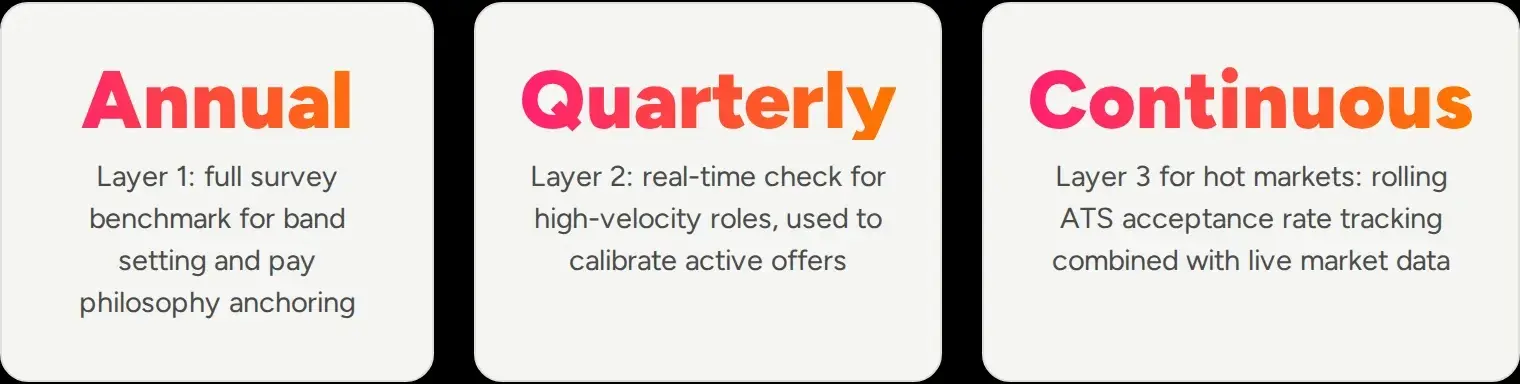
The most effective approach we see in practice is a two-layer model. The first layer is your annual survey data, which provides a statistically rigorous foundation for your compensation bands and your overall pay philosophy positioning. You run this annually and use it to set the structure within which all your pay decisions operate.
The second layer is a quarterly or continuous real-time check for the role clusters where market velocity is highest. This layer does not replace your survey anchor. It adjusts it. Say your survey data puts the P75 for a Senior Data Scientist at X, and your real-time data suggests the market has moved 8% above that in the past six months. You do not scrap your bands. You apply a market adjustment factor to your offer decisions in that role cluster while flagging the divergence for your next full band review.
This approach gives you the statistical credibility of survey data with the timeliness of real-time signals. It also keeps your compensation framework stable enough that managers can use it confidently. They don't feel as if the numbers change every month based on whatever data point someone pulled last week.
Automated market adjustment recommendations
Sometimes Tallect detects a sustained divergence between your survey anchor and real-time market movement in a specific role cluster. When that happens, it generates a market adjustment recommendation. The recommendation shows the estimated gap, the confidence level based on data volume, and the projected impact on offer acceptance rates if no adjustment is made. Your team reviews and approves the recommendation. Tallect handles the monitoring so you are not relying on someone remembering to check.

The hidden cost of data lag
The direct cost of data lag is visible in your offer acceptance rate. But there is a secondary cost that is harder to measure and more damaging over time: the erosion of manager confidence in the compensation framework.
When managers see their offers declined repeatedly and cannot get a satisfying explanation for why the numbers are where they are, they start to work around the system. They request off-cycle band exceptions. They lobby for individual role premiums. They bring compensation into offer conversations in ways that undermine pay equity by creating inconsistent standards across similar roles.
None of this happens because managers are acting in bad faith. It happens because they need to close candidates, and the tool they have been given, a stale salary band, is not helping them do that. Giving managers access to current market data, even in a summarised form, reduces the pressure to deviate from the framework because the framework stops feeling arbitrary.
What it means for your data budget
One practical implication of moving to a two-layer model is that your data spend may shift. Annual survey subscriptions will likely remain a core spend. But you may find that a fourth survey subscription adds less than a real-time data feed covering your top 20 role families in your primary hiring markets.
The question to ask your current data providers: what is the collection date of the data I am using, and how often is it updated? If the answer is once a year, that is a survey. If the answer is monthly or continuously, that is a real-time feed. The cost and the use case are genuinely different, and treating them as interchangeable is where most data budget inefficiency comes from.
Frequently asked questions
How do I know if my current data is causing offer problems?
The clearest signal is your offer acceptance rate segmented by role family. Watch for acceptance rates dropping in specific clusters while staying stable in others. If the declining clusters are in fast-moving talent markets, data lag is a likely contributing factor. Pull your declined offer data for the past six months and check whether the offers that were declined were concentrated in particular roles or levels.
What real-time data sources are worth paying for?
The most reliable real-time sources are platforms that aggregate data from actual compensation transactions rather than purely from job postings. Platforms like Levels.fyi, Radford's live data feed, and similar services that draw from ATS integrations or verified employee submissions tend to be more reliable than those relying solely on scraping advertised salary ranges. The key question to ask any provider is what percentage of their data comes from verified sources versus self-reported or inferred figures.
Can I use real-time data as my primary benchmarking source?
In some role categories, particularly tech roles with high posting volumes, real-time data is robust enough to use as a primary source. For most roles, it works best as a supplement to rather than a replacement for survey data. The statistical sample sizes in real-time sources for niche or senior roles are often too small to be reliable on their own. The lack of standardised job definitions also makes comparison difficult without the anchoring that survey job families provide.
How do I tell managers which data to use for which decisions?
The clearest framing is to tie the data type to the decision type. For annual compensation reviews and band setting, use survey data as the primary anchor. For active offer decisions, give managers a market adjustment factor that accounts for current conditions. Present it as a validated adjustment to the band, not a replacement for it. This keeps the framework consistent while giving managers the current-market context they need.
Does Tallect integrate both types of data?
Yes. Tallect connects to multiple survey data sources and live market feeds, presenting both in a unified view per role family. The platform shows where your current survey anchor sits relative to real-time market movement. Your team can see the divergence and make informed adjustment decisions without having to manage multiple tools and spreadsheets.
What is a reasonable market adjustment factor?
A market adjustment is typically expressed as a percentage premium applied to the survey-based midpoint for a specific role cluster. Say your survey data shows a P75 of 100 for a role and your real-time signals suggest the market has moved to 108. An 8% market adjustment applied to active offers in that cluster reflects current conditions while keeping the adjustment documented and auditable. Many organisations cap market adjustments at a set level before triggering a full band review (source needed).
What if real-time data and survey data tell very different stories?
A divergence greater than 15 percent between your survey anchor and real-time signals is a significant flag. It usually warrants investigating the cause before acting on either number alone. The divergence could reflect a genuine market shift, a difference in how roles are being defined across your data sources, or a geographic anomaly. In most cases, the right response is to check a third data source and look at your own internal hiring data before making a band decision based on a single divergent signal.
Is real-time data more useful in some industries than others?
Yes, significantly. Technology, financial services, and professional services tend to benefit most from real-time data because talent markets in those sectors move quickly and skill premiums appear and disappear faster than annual surveys can capture. Industries with more stable talent markets, such as traditional manufacturing or public sector roles, typically see less value from real-time data. Their underlying market does not change fast enough to make survey data genuinely stale within a 12-month window.
What about using LinkedIn Salary or Glassdoor as real-time data?
Consumer-facing salary tools like LinkedIn Salary and Glassdoor are based on self-reported data, which introduces significant bias. They overrepresent people who are actively looking or recently changed jobs, tend to skew toward higher earners who are more likely to report, and have inconsistent role definitions. They are useful for a rough directional sense but should not be used as primary data sources for compensation decisions. Always supplement with professionally administered sources.
How do we handle real-time data where our hiring volume is low?
If you hire fewer than five to ten people a year in a given role family in a market, your own ATS data will not give you statistically meaningful signals. In those cases, rely more heavily on survey data supplemented by conversations with specialist recruiters in that market. They have direct visibility into what candidates are accepting from comparable employers. This qualitative triangulation is often more useful than a thin real-time dataset.
How often should we review which data cadence each role cluster needs?
Annually is the minimum, at the start of each benchmarking cycle. Some events should also trigger an ad-hoc review of the data cadence for the affected role clusters:
- a material change in your hiring volume for a specific role
- a sudden spike in attrition
- a significant market event, such as a major employer entering or leaving your talent market
The decision about which roles need real-time data is not static and should be revisited when your talent environment changes.