Why traditional salary surveys lag the market
A salary survey published in Q4 often contains data collected 9 to 12 months earlier. Here is where that lag builds up, and what it costs.
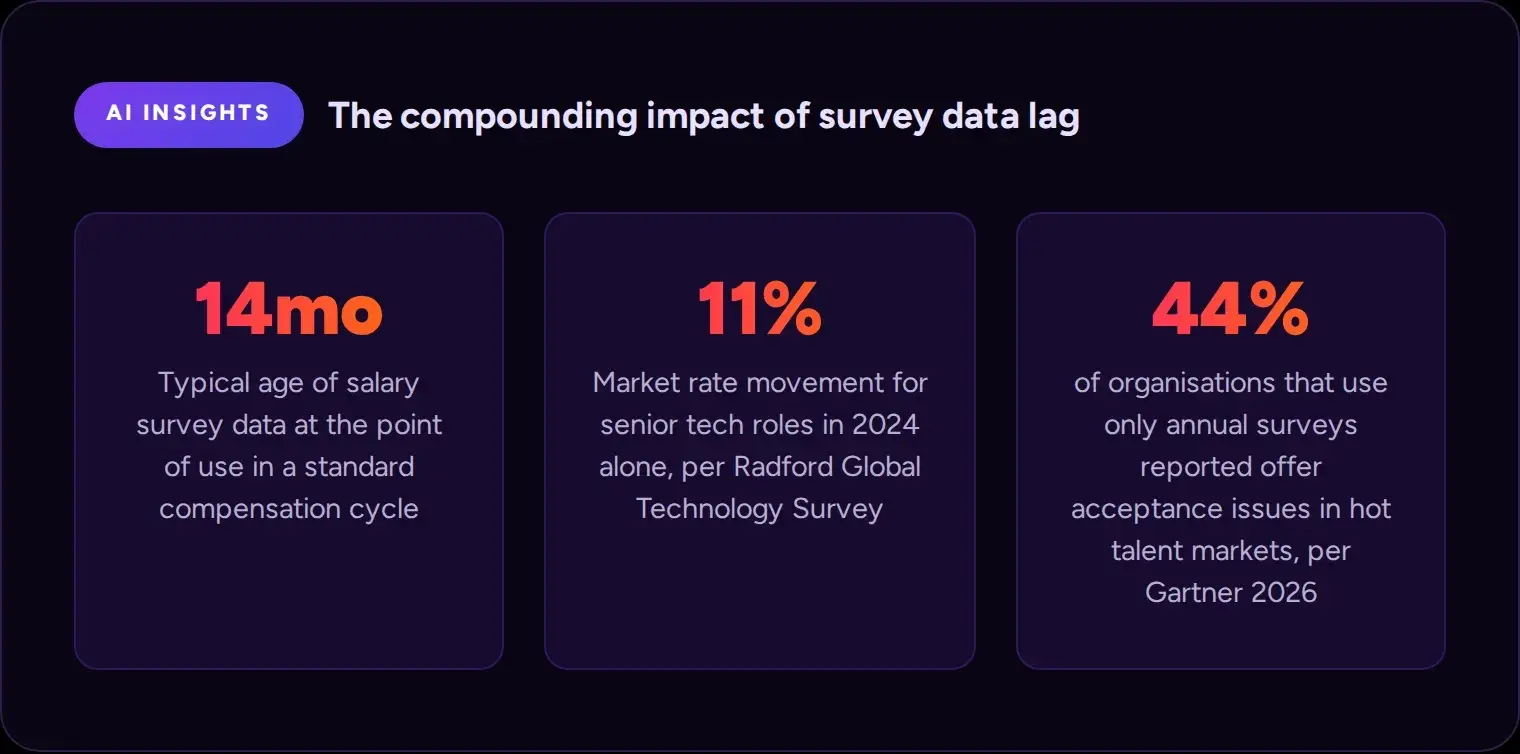
The average major salary survey collects data between February and May, publishes it between August and November of the same year, and gets used in compensation reviews running from January to April of the following year. From data collection to practical use, that is a gap of 12 to 18 months. In a year when market rates for tech roles move sharply, as they did in 2024, that lag is not a minor inconvenience (source needed).
Salary surveys are the foundation of most corporate compensation benchmarking, and they have genuine strengths. They are built from actual payroll data submitted by real organisations. They cover thousands of companies across standardised job families. The statistical rigour is, in most cases, solid.
The problem is not the quality of the data at the time it was collected. The problem is the structural delay between collection and use that is baked into the format. Understanding where that delay comes from is the first step to managing it.
Where the lag accumulates
Lag point 1: collection window
The survey asks for last year's data. Most major surveys ask participating organisations to submit compensation data from the current year, typically capturing effective salaries as of a fixed date in Q1 or early Q2. But that submission window usually asks about current or recently effective rates. So the data reflects what was being paid in January or February of the collection year, not what will be offered in six months.
Lag point 2: processing and publication
Analysis and publication take 4 to 6 months. After the submission window closes, the survey provider has to aggregate responses, clean the data, apply geographic and industry cuts, validate submissions, and publish results in a usable format. This process typically takes between four and six months. A survey that closes submissions in April publishes results in September or October at the earliest. The rigour of the process is why the surveys are valuable. But that rigour takes time.
Lag point 3: adoption cycle
Organisations use the data in the next annual cycle. A survey published in October 2025 usually feeds into compensation planning that runs through Q4 2025 and Q1 2026, with the resulting pay bands taking effect from January or April 2026 onwards. By the time a band calibrated using that survey governs an offer in June 2026, the underlying data is 16 to 18 months old. No one does this deliberately. It is simply the default rhythm of how annual compensation cycles work.
What lag looks like in practice
Here is a concrete example. Imagine your January 2026 compensation review sets your Senior Software Engineer band at P75. It uses data from the most recent Radford survey, published in October 2025 and reflecting salaries effective in March 2025. Your band is 14 months behind the current market before a single offer goes out.
Suppose that during 2025, the market for Senior Software Engineers in your key hiring cities moved by 8 to 12 percent. The drivers might include generalised inflation in tech compensation, increased competition from AI companies hiring engineering talent, and a spike in demand for engineers with specific infrastructure skills. Your survey data, which captured the market in March 2025, misses all of that movement.
You make 40 Senior Software Engineer offers in the first half of 2026. Your acceptance rate is 58 percent. A year earlier it was 74 percent. You have not changed anything about your employer brand, your process, or the roles themselves. The gap between your offer numbers and where the market actually is, right now, is the explanation.
Real-time market drift detection per role cluster
Tallect continuously monitors the gap between your survey-anchored pay bands and live market signals for each role family. When a meaningful drift appears, the platform surfaces it with a confidence rating based on data volume and source quality. Your team can make a mid-cycle adjustment before a 14-month lag becomes a wide offer gap. You don't have to wait for a declining acceptance rate to tell you what you should have caught six months earlier.
Why some roles suffer more
Survey lag is not equally damaging across all role types. For roles where market rates are relatively stable year over year, a 14-month lag is tolerable. The market for, say, a Payroll Manager or an Office Administrator does not typically move 10 percent in twelve months. If your survey data is slightly stale for those roles, the gap between your offer and the market rate is small enough that it rarely costs you a candidate.
The problem concentrates in two categories:
- roles where demand is growing faster than supply
- roles where new skill premiums have emerged or shifted significantly since the data was collected
AI and machine learning roles sit firmly in both categories. Enterprise security specialists have been in the same position for several years. Go-to-market roles in high-growth technology sectors have shown similar volatility.
For these categories, a 14-month data lag can translate into a substantial effective underpayment in your offer numbers (source needed). That gap is visible to candidates who have done their own research, which most senior candidates in competitive roles have done before they get to the offer stage.
The survey is not wrong. It accurately captured what the market paid 14 months ago. The question is whether that is the number you want to use when you are competing for a candidate who has three other offers on the table from companies that know where the market is today.
Role-level lag risk scoring
Tallect assigns a market velocity score to each role cluster in your compensation framework. High-velocity roles get flagged for supplementary real-time data checks at a shorter cadence. Low-velocity roles stay on the standard annual survey cycle. You stop applying the same refresh schedule uniformly to roles that have very different rates of market movement, which is where most of the practical risk sits.
How survey providers respond
The major providers are aware of this problem and have developed partial responses:
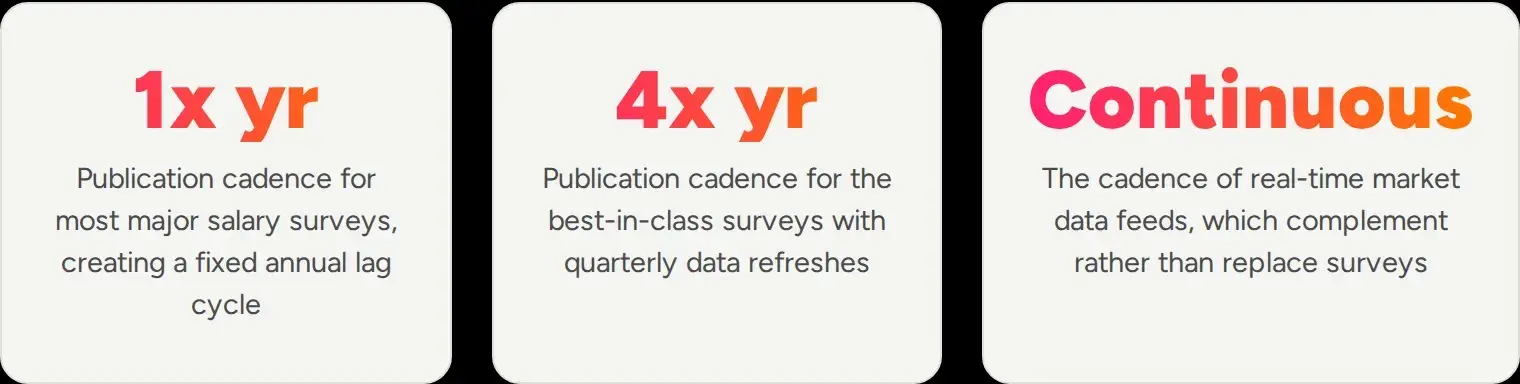
- Some surveys now publish quarterly refreshes rather than a single annual edition.
- Some offer aging adjustments, which apply an estimated market movement factor to project forward from the collection date to the current date.
- Some have started incorporating real-time data signals alongside traditional payroll submissions to give a blended view.
These are genuine improvements. A quarterly-refreshed survey with aging adjustments is meaningfully better than a once-a-year static publication. But it is worth understanding what these mechanisms can and cannot do.
Aging adjustments are projections, not measurements. They estimate what the market has done since data collection based on historical market movement rates. In a year where market conditions shifted unexpectedly, an aging adjustment built on historical patterns will understate the actual movement. The adjustment is better than no adjustment, but it is not the same as current data.
What to do about it
The practical response is not to abandon salary surveys. Their statistical reliability and broad role coverage make them the foundation of any serious compensation benchmarking effort. The response is to supplement them strategically.
For your high-velocity roles, layer a real-time signal on top of your survey anchor. That signal might come from a live compensation data platform, from your own ATS acceptance rate data, from job posting analytics, or from conversations with specialist recruiters in your key markets. Use that signal to understand the direction and magnitude of market movement since your survey data was collected. Apply a documented market adjustment to your offer decisions in those role clusters, and revisit the adjustment quarterly rather than annually.
For stable roles, your annual survey cadence is probably sufficient. The overhead of real-time monitoring across every role in your organisation is not worth the marginal benefit for roles where the market barely moves year over year.
Survey data supplementation at scale
Tallect integrates your existing survey subscriptions alongside live market feeds, automatically calculating role-level divergence and market adjustment recommendations. For a 500-role organisation, the monitoring that would require a full-time analyst to run manually runs continuously in the background. When it matters, the alert comes to your team rather than appearing as a declining offer acceptance rate three months later.

The compounding effect
Data lag does not just affect this year's compensation cycle. It compounds when organisations are slow to act on observed market movement and when the lag from one survey year carries into the next without a deliberate recalibration.
Consider an organisation that set its engineering bands using 2022 survey data. It then updated them with 2024 survey data reflecting 2023 market conditions, and is now using those bands in 2026. The cumulative gap between its pay framework and the current market may be substantially larger than any single year's lag would suggest. Each year of partial update, rather than full recalibration, compounds the drift.
Organisations that track their offer acceptance rate and voluntary attrition by role family can usually identify this compounding effect before it becomes acute. A consistent decline in either metric for a specific role cluster, in the absence of other obvious explanations, is often the signature of a pay band that has quietly slipped below market over several cycles.
The honest limitation of surveys
Survey providers do not advertise their data's age prominently. The collection date is usually disclosed in the methodology appendix, not on the first page of the output. This is not dishonest. It is standard practice. But it means that the consumers of survey data need to actively ask the right questions and build the lag awareness into how they use the results.
The question to ask any survey: what was the effective date of the data you collected for this report? The answer to that question, compared to the date you plan to use the data, gives you the real lag number. Many compensation professionals are surprised when they calculate it for the first time.
Frequently asked questions
How do I find out when a salary survey actually collected its data?
Look for the methodology section of the survey report, which should disclose the data collection window and the effective date of the salaries reported. If that information is not in the published report, ask your account manager directly. Any reputable provider will tell you. If the collection date is not disclosed at all, treat that as a red flag about the survey's overall transparency.
Are aging adjustments reliable enough to use?
They are better than nothing, but they are projections based on historical market movement, not measured current data. In stable markets where movement has been predictable, aging adjustments are reasonably accurate. In years of unexpected market disruption or rapid skill-premium shifts, they will understate the actual movement. Treat aging adjustments as a directional indicator rather than a precise market rate.
How much does data lag typically affect offer acceptance rates?
There is no universal answer because it depends on the role, the market, and the size of the lag. In fast-moving talent markets for high-demand roles, a 14-month lag that corresponds to 10 to 15 percent of market movement can reduce offer acceptance rates significantly. Gartner's 2026 compensation data showed that offers more than 10 percent below current market rates were far more likely to be declined than offers within 5 percent of market (source needed).
Should we buy more surveys to compensate for data lag?
Not necessarily. Buying additional surveys with the same collection cadence will not solve a lag problem, since all annual surveys share the same structural delay. The more targeted response is to supplement your existing surveys with real-time data for the specific role clusters where lag causes the most damage, rather than adding more surveys with the same age characteristics.
Which roles are most affected by survey lag?
The most affected are roles in high-demand categories with fast-moving skill premiums:
- software engineering
- AI and machine learning
- cybersecurity
- data engineering
- product management in tech
- commercial roles in high-growth sectors
Roles with stable supply-demand dynamics are much less affected by survey lag in practice. That includes most support functions, traditional finance and operations, and established professional services roles.
What is the ideal data cadence for a mid-size organisation?
For a mid-size organisation with limited compensation team capacity, the most practical approach is annual survey data as the primary foundation, supplemented by a real-time data feed covering your top 20 to 30 highest-priority role families. This covers the roles where lag risk is highest without creating an impossible monitoring burden across every position in the organisation.
Can I use job posting data as a proxy for real-time market rates?
Job posting data is a useful directional signal but has significant limitations. It captures what companies are advertising, not necessarily what they are paying to close offers. Companies with aggressive compensation often do not advertise their full package publicly. Posting data also varies considerably in how companies define and title roles, making apples-to-apples comparisons difficult. Use it as a cross-check rather than a primary source.
How do I make the case to leadership that our survey data is too old?
The most compelling argument is a segmented offer acceptance rate analysis. Pull your acceptance rates for the past 12 to 18 months by role family. Show that acceptance rates have declined specifically in the role clusters where market movement has been fastest, while staying steady for stable roles. That is a data-driven case that is difficult to dismiss. Anecdotes about individual declines are easy to dismiss. A trend across 40 offers in a specific role cluster is harder to argue with.
Do premium survey subscriptions have less lag than standard ones?
Premium tiers at most providers offer more granular cuts of the data, broader role coverage, and faster access to published results. Some also include real-time or more frequently updated supplementary data. But the fundamental collection-to-publication cycle is similar across tiers. The premium is usually worth paying for the depth of analysis. It rarely buys meaningfully more current data, unless the provider explicitly offers a separate real-time product.
What documentation should we keep about our data sources?
At minimum, document four things for each survey:
- the provider name
- the survey edition year
- the effective date of the underlying data
- the date you last used it in a compensation review
This documentation lets you calculate your actual lag at any point and provides an audit trail if your compensation decisions are ever reviewed by an external party. It also makes it straightforward for a new team member to understand how current the data they are working with actually is.
How does Tallect handle survey data age?
Tallect displays the data vintage alongside every benchmark figure, so your team always knows how old the data underlying a recommendation is. The platform also cross-references published survey data against live market feeds, flagging where the two have diverged significantly. You can see the survey anchor and the current market signal in the same view, with the gap clearly labelled. That makes mid-cycle adjustment decisions straightforward, without manual research across multiple tools.