Is Your Sales Incentive Program Paying Off? How to Calculate ROI
A finance-friendly guide to measuring whether your sales incentive programme pays for itself, with honest methods, full costs and a worked example.
Most companies can tell you exactly what they paid in sales incentives last year. Far fewer can tell you what those incentives returned. That gap matters in two common moments:
- a CFO asks whether a new accelerator is worth its cost
- a sales leader wants budget to repeat a programme that seemed to work last quarter
Incentive ROI is hard to pin down because sales results have many causes. A strong quarter might reflect the incentive. It might also reflect any of these:
- a new product
- a price change
- a marketing campaign
- a competitor’s stumble
- a market that was growing anyway
If you credit the programme with all of it, the ROI looks excellent and means very little.
So the honest answer is that incentive ROI is an estimate. That is not a reason to skip it. It is a reason to do it carefully:
- state your assumptions
- measure only the result the programme caused
- count every cost
- show a range rather than a single number
This guide shows how. It covers:
- what ROI means for an incentive programme
- how to count the full cost
- how to measure the benefit
- which measurement method to use
- which mistakes distort the result
One illustrative example runs the numbers step by step.
What ROI means for an incentive programme
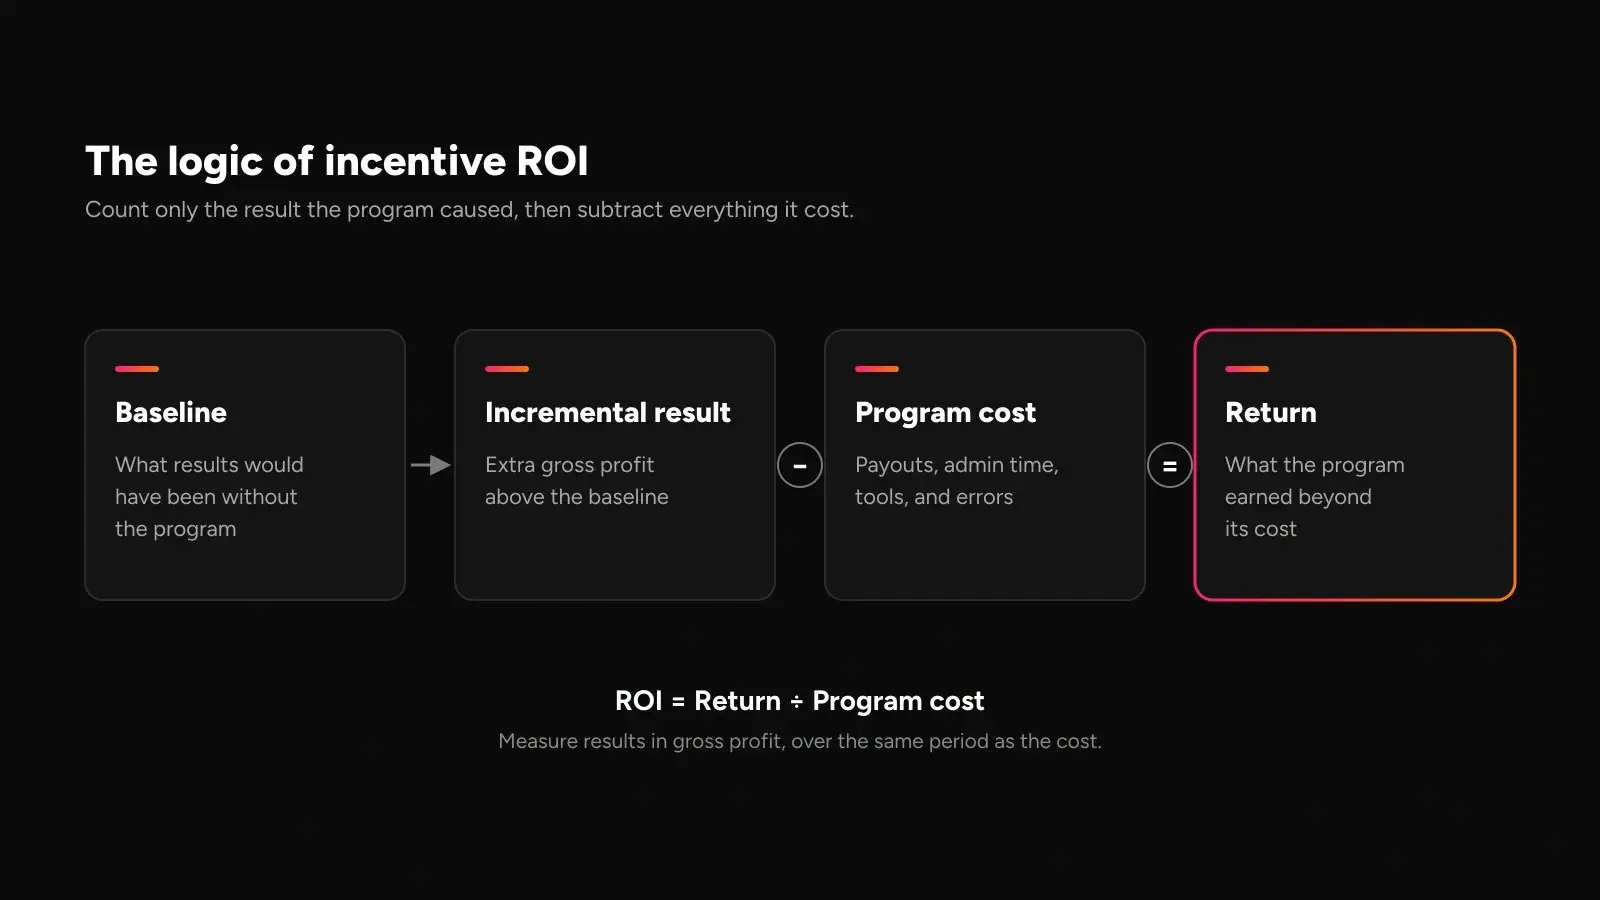
Return on investment (ROI) compares what a programme returned with what it cost. For a sales incentive programme, the investment is everything the company spends to run it. The return is the extra profit the programme produced.
The basic formula is:
ROI = (Incremental gross profit − Total programme cost) ÷ Total programme cost
Multiply the result by 100 to show it as a percentage. An ROI above zero means the programme earned back more than it cost. An ROI below zero means it cost more than it returned.
Why the benefit must be incremental
The word that does the most work in that formula is incremental. The return is not the total revenue the team booked while the programme ran. It is the difference between what happened and what would have happened without the programme. That second number, the baseline, can never be observed directly. You have to estimate it, and the section on measurement methods explains the main ways to do that.
If the team would have booked most of the revenue anyway, the programme’s real contribution is small, even when total results look strong. Counting total results instead of incremental results is the quickest way to overstate incentive ROI.
Why gross profit, not revenue
Measure the return in gross profit, not revenue. Revenue is not money the company keeps, because each extra sale carries its own costs, such as delivering the product or service. A programme that adds $1,000,000 in revenue at a thin margin may return less than one that adds a smaller amount at a healthy margin.
Using gross profit makes the comparison with programme cost fair. Both sides are then measured in money the company actually gains or spends. Agree on the margin definition with Finance before you start.
Keep the time frame consistent
Measure the return and the cost over the same period. If a quarterly programme pays some rewards a month after the quarter closes, include those payouts. If the programme may have pulled deals forward from the next quarter, look at the period after it as well.
Count the full programme cost
The cost side looks simple, because payouts are easy to find. But payouts are only part of what a programme costs. Leave out the rest and the ROI will look better than it is.
Start with payouts, then add everything else
Programme payouts include any commission, bonus or reward paid because of the programme. That covers three kinds of programme:
- Accelerators. Count the extra amount paid above the regular plan, plus the regular commission on deals the programme produced.
- SPIFFs and contests. A SPIFF is a short-term sales incentive. For SPIFFs and contests, count the full value of the rewards.
- Non-cash rewards. For trips or merchandise, count what the company paid, including fulfilment.
Then add the costs that do not show up as payouts:
- Administration time. This is often the largest. It covers hours spent by sales operations, Finance, HR and managers on several tasks:
Cost those hours at a loaded hourly rate agreed with Finance. - setting up the programme
- calculating and checking payouts
- answering questions
- resolving disputes
- Tools and systems. Tools and systems used to run incentives also belong on the cost side, not in a separate business case.
- Errors and overpayments. These are easy to forget. When payouts are calculated by hand, mistakes happen, and some overpayments are never recovered. If your programme has a history of corrections, include an allowance based on past records.
- Employer costs on variable pay. Include payroll taxes or benefit contributions linked to variable pay, where they apply. These rules vary by country, so check local requirements with Finance and take advice where needed.
Cost item | What to include | Where the data usually comes from |
|---|---|---|
Programme payouts | Commission, bonus or rewards paid because of the programme | Commission and payroll records |
Accelerators and SPIFFs | Extra payouts above the regular plan | Commission records |
Employer costs on payouts | Payroll taxes and benefit costs linked to variable pay, where they apply | Payroll and Finance |
Administration time | Hours spent designing, calculating, checking and resolving disputes | Time estimates, costed at loaded hourly rates |
Tools and systems | The share of incentive tools used by the programme | Finance and IT budgets |
Errors and overpayments | Corrections, unrecovered overpayments and dispute settlements | Commission adjustment records |
Launch and communication | Materials, sessions and reward fulfilment | Programme and marketing budgets |
Caption: The full cost of a sales incentive programme, and where to find the data.
Count only the costs the programme caused
Like the benefit, cost should be incremental. If a rep would have earned regular commission on a deal anyway, that commission is not a programme cost. If the programme caused the deal, the regular commission on it is part of what the programme cost. Be consistent: the logic that decides which results are incremental should also decide which payouts are.
Measure the incremental benefit
The benefit is the extra gross profit the programme produced. Getting it right means separating the programme’s effect from everything else that moved results during the same period.
Incremental versus total results
Start by naming the result the programme was meant to change. That might be any of these:
- bookings
- revenue
- new customers
- sales of one product
- deals above a certain size
Then estimate the baseline: what that result would have been without the programme. The incremental result is the difference.
Incremental result = Actual result − Baseline result
Use the same definitions on both sides. If the programme pays on bookings, measure bookings. If revenue is recognised later, decide whether you are judging the programme on bookings now or on revenue later, and stick to that choice.
Why margin matters
Convert the incremental result to gross profit by applying the margin on the sales the programme produced. That margin may differ from the company average. Incentives sometimes push reps towards easier sales, bigger discounts or lower-margin products. If the programme’s deals were discounted more heavily than usual, use their actual margin, not the average. A programme that grows revenue while eroding margin can show a weak or even negative return.
Treat soft returns separately
Some benefits are real but hard to value. A well-run programme may lift morale, help retain strong performers or speed up adoption of a new product. These effects matter, and leaders should hear about them. But they should not be added to the core calculation without solid evidence.
Report them separately, next to the main ROI, with a clear note on how confident you are. If you want to put a figure on retention, use your own turnover data and a replacement cost that Finance agrees with. Do not use a general figure for the cost of turnover or the value of engagement without a source (source needed). Keeping soft returns separate protects the credibility of the main number.
Choose a measurement method
The hardest part of incentive ROI is estimating the baseline. No method is perfect, because you can never see what would have happened without the programme. But some methods are far more reliable than others, and the right choice depends on how the programme was rolled out.
Method | How it works | Best for | Main weakness |
|---|---|---|---|
Before and after | Compares results during the programme with a period before it | A quick first read in a stable market | Credits seasonality, market shifts and other initiatives to the programme |
Comparison group | Compares a group on the programme with a similar group not on it, over the same period | Programmes rolled out to some teams first | Groups may differ, and behaviour can spill over between them |
Cohort comparison | Compares similar cohorts, such as reps hired in the same quarter of different years | Programmes for new hires or specific segments | Small groups make results noisy |
Trend adjustment | Projects expected results from past trends and seasonality, then compares actual results with the projection | Company-wide programmes with no comparison group | Depends heavily on forecast assumptions |
Caption: Four ways to estimate the baseline for an incentive programme.
Before and after
The simplest method compares results during the programme with results in an earlier period. It is quick and needs little data, which makes it useful for an early read. Its weakness is that it assumes nothing else changed. Seasonality, market conditions, pricing and other initiatives all move results, and this method credits all of them to the programme.
Comparison group
A comparison group is a set of reps or teams who did not take part in the programme but are similar to those who did. You compare how results changed for both groups over the same period. If both groups grew, only the extra growth in the programme group counts as incremental. When you can use it, this is the strongest of the four methods, because both groups face the same market and the same season.
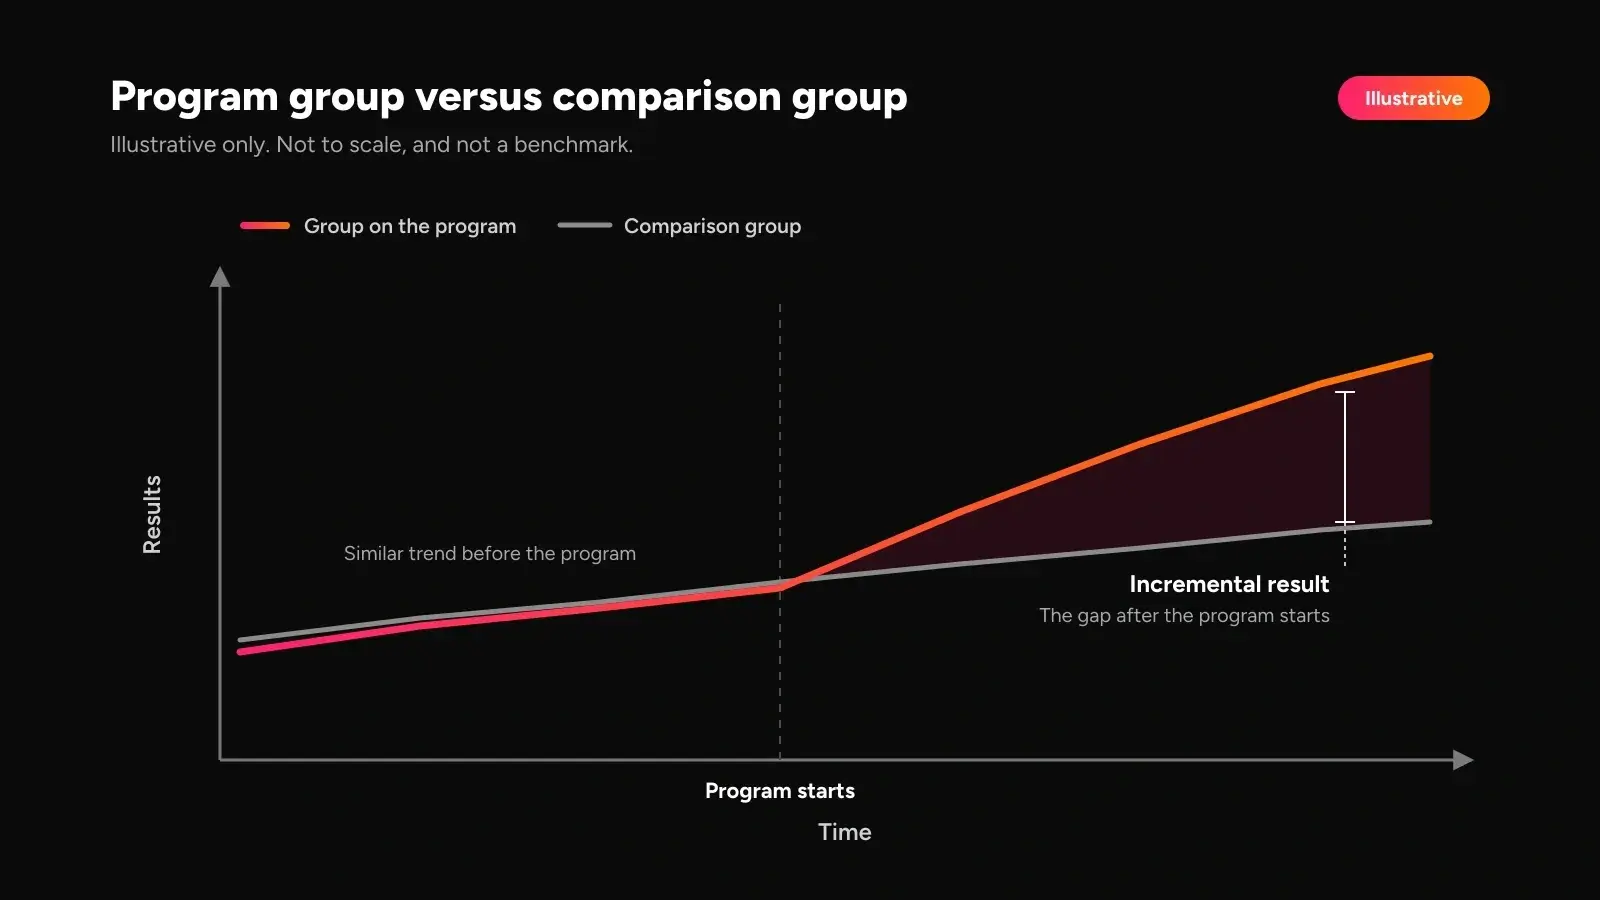
The difficulty is finding a fair comparison:
- groups may differ in territory, experience or account mix
- reps may change their behaviour simply because they heard about the programme
- withholding an incentive from some people can raise fairness concerns, so agree on the approach with HR before launch
A staged rollout, where some regions start a quarter earlier than others, is often the most practical way to create a comparison group.
Cohort comparison
A cohort comparison looks at similar groups at different times. For example, you might compare reps hired in the same quarter of two different years, one group with the programme and one without. It suits programmes aimed at new hires or specific segments. Its weakness is size: cohorts are often small, so one large deal can swing the result.
Trend adjustment
When a programme covers everyone at once, there is no comparison group. Instead, project what results would have been from past trends and seasonal patterns, and compare actual results with the projection. Finance may already have a forecast that can serve as the baseline. Because the result depends on that forecast, show how the ROI changes if the forecast was a little high or a little low.
Whichever method you use, write down the assumptions. Where the method is weak, show a range rather than a single figure.
A worked example
This example runs one hypothetical programme through the steps above. Every figure is illustrative only. It is not a benchmark, a typical result or a recommendation.
The programme
A company runs a one-quarter accelerator for a sales team of 20 reps. During the quarter, reps earn a higher commission rate on bookings above their quarterly quota. The goal is to lift bookings in a quarter that is usually slow.
Building the calculation
- Set the baseline. The programme covers the whole team, so Finance uses a trend adjustment and checks it against a smaller team in another region that did not run the programme. Together, these suggest the team would have booked $10,000,000 without the accelerator.
- Measure the incremental result. The team actually books $12,000,000, so the incremental result is $2,000,000.
- Convert it to gross profit. Finance confirms an illustrative gross margin of 60% on the quarter’s deals, after checking that discounting was no deeper than usual. Incremental gross profit is $1,200,000.
- Count the full cost. That covers accelerator payouts, regular commission on the incremental bookings, administration time, launch and communication, and an allowance for errors.
Line item | Amount | Note |
|---|---|---|
Incremental bookings | $2,000,000 | $12,000,000 actual minus $10,000,000 baseline |
Incremental gross profit | $1,200,000 | $2,000,000 × 60% illustrative margin |
Accelerator payouts | $240,000 | Paid above the regular plan |
Regular commission on incremental bookings | $160,000 | Paid only because the extra deals closed |
Administration time | $25,000 | Sales operations and Finance hours, costed |
Launch and communication | $10,000 | Materials and team sessions |
Error and overpayment allowance | $15,000 | Based on past corrections |
Total programme cost | $450,000 | Sum of the five cost lines |
ROI | 167% | ($1,200,000 − $450,000) ÷ $450,000 |
Caption: Illustrative ROI calculation for a hypothetical one-quarter accelerator. All figures are illustrative US dollar amounts, not a benchmark or a typical result.
In this illustration, the programme returns $750,000 more in gross profit than it cost:
ROI = ($1,200,000 − $450,000) ÷ $450,000 = 167%
What if the effect was half as large?
Now suppose the baseline was too low, and the team would have booked $11,000,000 without the programme. The incremental result falls to $1,000,000, and incremental gross profit falls to $600,000.
The accelerator payouts do not change, because they are based on what the team actually booked, not on how much of it the programme caused. The regular commission treated as incremental halves to $80,000, so total programme cost becomes $370,000.
ROI = ($600,000 − $370,000) ÷ $370,000 = 62%
The programme still pays for itself in this illustration. But a single assumption about the baseline cuts the return from 167% to 62%. That is why incentive ROI should be presented as a range, built from a low, middle and high baseline, with a note on which assumption drives the result most.
Related metrics finance asks for
ROI answers one question: did the programme return more than it cost? Finance teams usually want a few related metrics alongside it, because they show efficiency and risk in ways ROI does not.
Metric | Formula in words | What it tells you |
|---|---|---|
Cost of sales (sales compensation) | Total sales compensation divided by revenue for the same period | What the company spends on sales pay for each unit of revenue |
Payout as a share of revenue | Incentive payouts divided by revenue for the same period | How much of each unit of revenue goes to variable pay |
Change in total payout divided by change in attainment, in percentage points | How quickly incentive cost rises as results improve | |
Payback period | Total programme cost divided by incremental gross profit per month | How many months the programme takes to earn back its cost |
Caption: Metrics Finance usually asks for alongside incentive ROI.
Cost of sales
In this context, cost of sales means total sales compensation as a share of revenue. In accounting, the same term can mean the cost of goods sold, so agree on the definition with Finance before you report it. Tracked over time, it shows whether you are paying more or less for each unit of revenue. What counts as a reasonable level varies by industry and business model (source needed), so compare against your own history rather than a general rule.
Payout as a share of revenue
This narrower view looks only at variable pay. It shows how much of each unit of revenue goes to incentives, and whether a programme pushed that share up.
Payout per point of attainment
This shows how steeply incentive cost rises as results improve. A steeper rise above target is expected with accelerators. But Finance will want to know how steep, so it can plan for a strong quarter.
Payback period
For programmes with upfront costs, such as a launch, the payback period shows how long incremental gross profit takes to cover the total cost. It is useful when comparing programmes of different lengths.
Mistakes that distort ROI
Each of these mistakes makes a programme look better or worse than it really is. Most of them push ROI up, which is why a result that looks too good deserves a second look.
Crediting the programme with everything
Attribution is the biggest risk. If a new product, a price change or a marketing campaign ran during the same period, part of the result belongs to them. List every initiative that ran alongside the programme. Then adjust the baseline, or show the ROI with and without the overlap.
Ignoring seasonality
Comparing a strong quarter with a weak one will flatter any programme that runs in the strong quarter. Compare like with like, or adjust the baseline for seasonal patterns.
Missing pulled-forward deals
Short programmes can encourage reps to close early the deals that would have closed next quarter anyway. The programme quarter looks strong and the next quarter looks weak. Measure the period after the programme too, and subtract any dip from the result.
Overlooking margin erosion
If reps discounted more heavily to hit a threshold, revenue rises while margin falls. Measure ROI on gross profit, using the margin on the programme’s own deals.
Missing gaming
Incentives can change behaviour in ways that help the payout but not the business:
- splitting deals
- holding deals to time a threshold
- booking deals that later cancel
Check cancellations and unusual deal patterns, and remove results that did not stick.
Ignoring admin and error costs
Leaving out administration time, corrections and disputes understates cost. The more manual and complex the programme, the more these costs matter.
Measuring too soon
Some effects take time to appear. Some costs, such as late payouts or clawbacks, arrive after the programme ends. Measuring on the day the programme closes can miss both. Wait until results and payouts have settled, and plan a follow-up review.
How to improve programme ROI
Measuring ROI is only useful if it changes what you do next. These levers usually have the most effect.
Design for the result you want
Tie the programme to one clear result that the business needs and that reps can influence. Set thresholds so the programme pays for genuine extra effort, not for results that would have come anyway. If the programme targets one product or segment, measure ROI on that result alone.
Target the programme
A programme that covers everyone also pays for a lot of baseline results. Where it makes sense, focus it on the teams, segments or periods where extra effort is most likely to change the outcome. Targeting also makes measurement easier, because the rest of the team becomes a natural comparison group.
Measure on a regular cadence
ROI worked out once, by hand, after a programme ends, is hard to act on. Set a regular review, quarterly for most programmes, with the same definitions, baseline method and cost lines each time. You might use spreadsheets or a dedicated system such as Tallect’s Sales Incentive module. Either way, the goal is consistent data and definitions every quarter, so each review builds on the last.

Cut admin effort and errors
Administration time and errors are programme costs, so reducing them raises ROI directly. Four steps help:
- simplify plan rules
- remove manual steps
- document calculations so Finance can check them
- track corrections so you know what errors are costing
Frequently asked questions
Should you measure incentive ROI on revenue or gross profit?
Measure it on gross profit wherever you can. Revenue includes costs the company never keeps, such as the cost of delivering the product or service, so comparing revenue with programme cost overstates the return. Gross profit puts both sides of the calculation in money the company actually gains or spends. Use the margin on the deals the programme produced, because incentives can shift sales towards discounted or lower-margin business.
What is a good ROI for a sales incentive programme?
There is no single number that counts as good. At a minimum, a programme should return more incremental gross profit than it costs, and that result should hold across a reasonable range of baseline assumptions. Beyond that, compare it with other uses of the same money, such as hiring, marketing or pricing changes. Treat any general benchmark with caution (source needed), because programmes, margins and markets differ widely.
How do you separate the effect of incentives from other factors?
Estimate a baseline of what would have happened without the programme, then count only results above it:
- Comparison group. The most reliable way is a comparison group, such as a region that starts the programme a quarter later.
- Trend and seasonality. Where that is not possible, adjust for trend and seasonality.
- Other initiatives. List every other initiative that ran at the same time.
Show the result as a range rather than a single figure.
How long should you measure a programme before judging it?
Measure for the full programme period, plus enough time afterwards for results and payouts to settle. That means waiting for three things:
- deals to close or cancel
- late payouts to process
- any clawbacks to apply
Check the following period for pulled-forward deals as well. For longer programmes, take an early read to catch problems, but hold off on a final judgement until the data is complete.
What is cost of sales in sales compensation?
In sales compensation, cost of sales is what a company spends on paying its sales team, shown as a share of the revenue that team produces. It includes base salaries, commissions, bonuses and incentive payouts. In accounting, the same term can mean the cost of goods sold, so agree on a definition with Finance before you report it. Compare against your own history rather than a general rule.
Can you measure the ROI of non-cash incentives?
Yes. The method is the same as for cash incentives: estimate the incremental gross profit and compare it with the full cost. For rewards such as trips, events or merchandise, the cost includes what the company paid, fulfilment and administration. Tax treatment of non-cash rewards varies by country, so check with Finance and take advice. Report harder-to-measure benefits, such as recognition and morale, separately.
How often should you review incentive programme results?
It depends on the programme:
- Most programmes. Review every quarter, using the same definitions, baseline method and cost lines each time so results can be compared.
- Short programmes, such as a one-quarter SPIFF. Review when they end, then follow up once results have settled.
- Larger plan changes. Give these a fuller review once a year, alongside business planning, so incentive spending is weighed against other uses of the budget.
Track incentive ROI every quarter
Tallect brings payout cost, attainment and plan effectiveness into one view, so you can track the return on your incentives every quarter instead of rebuilding it by hand.